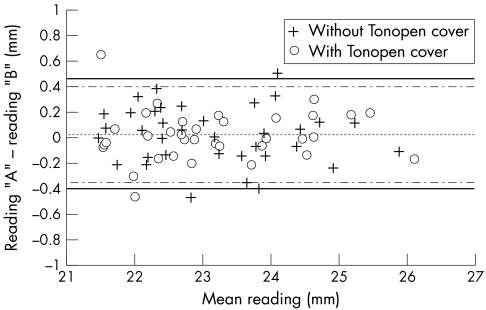
Figure 3.
Intrasessional repeatability of readings taken without (crosses) and with (open circles) the disposable cover during session 1. Difference data are plotted versus mean data. Reading “A” indicates the first and “B” the second of a pair. The overall mean differences were virtually identical for each condition (centre dotted line), the outer lines represent 95% confidence limits without (solid line) and with the cover (broken line). Table 1 summarises numerical data relating to this figure.

