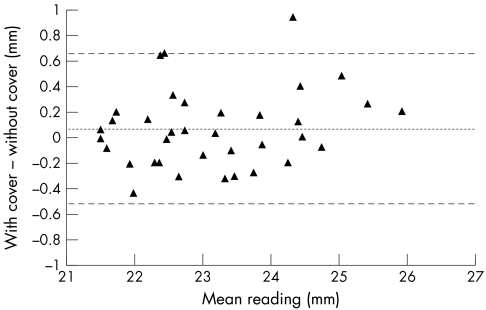
Figure 4.
Intrasessional validity of readings taken during session 1. The data are computed from the first of each pair of readings. The centre line represents the mean difference and the outer lines the 95% confidence limits. A slight preponderance of positive data (ordinate) indicates a tendency for longer readings being obtained with the disposable cover in place. Table 1 summarises numerical data relating to this figure.

