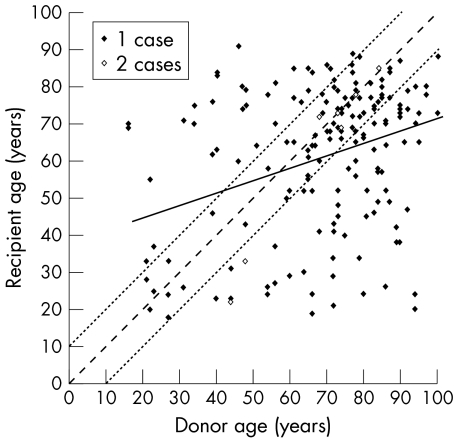
Figure 2.
Distribution of recipient age in relation to donor age (n = 179). Note there is only a weak correlation (r = 0.334, p<0.01) between the two, as we did not deliberately age match. Solid line: straight line of linear regression; fine dotted lines: age matching of more or less than 10 years. Less than half the corneas (42.5%) were matched in this way.

