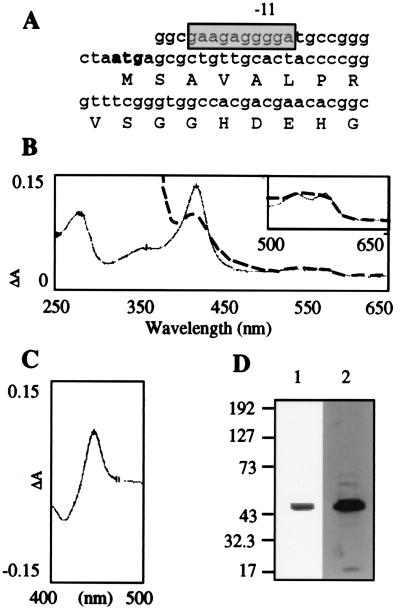
Figure 2.
(A) Potential Shine–Dalgarno sequence (shadowed box) of the MT CYP51 gene; the ATG is represented in boldface characters. (B) Absorbance of purified MT P45014DM (400 pmol), absolute oxidized form (regular trace), and sodium hydrosulfite reduced form (dashed trace). Inset shows the α- and β-bands for the oxidized and the reduced forms. (C) Differential CO-reduced P450 spectrum of purified MT P45014DM (400 pmol). (D) Silver staining (1) and immunoblot analysis (2) using 1 pmol and 0.4 pmol of purified MT P45014DM, respectively. MT P45014DM antibody prepared with TiterMax@Gold as adjuvant was used at a 1:5,000 dilution. Protein G-horseradish peroxidase conjugate (Bio-Rad) was used as a second antibody, and an enhanced chemiluminescence kit was used for detection.

