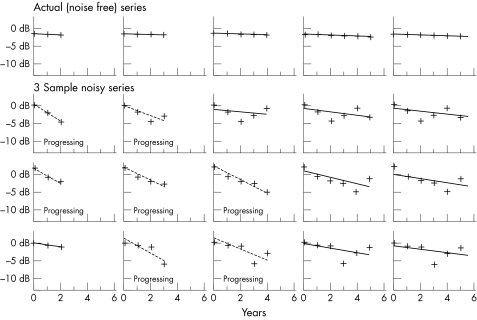
Figure 1.
Illustrative series for a stable virtual eye. In the top row, the sensitivity at a point is specified as deteriorating at 0.1 dB/year over 6 years; as the series gets longer (moving from left to right along the series) with the addition of more points, PLR is used to determine whether the point would be flagged as progressing based on the readings so far. The second, third, and fourth rows represent three possible series of artificial sensitivities, after noise has been added in.

