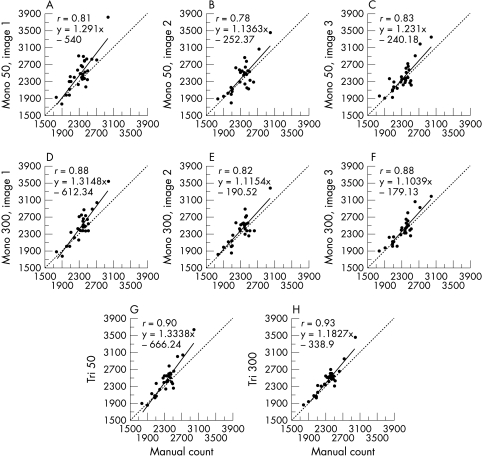
Figure 3.
The relations between each of the eight automated analysis methods and manual count for homogeneous corneas (group 1, n=30). Whatever the analysis method, discrepancies with the manual count were rare. Correlations were best with the tri-image mode, for 300 and even 50 cells. For all correlations, p was <0.001.

