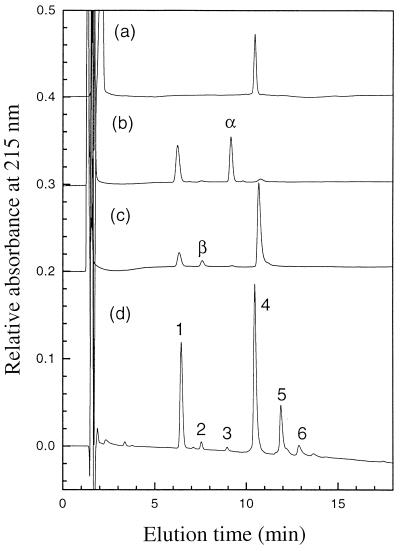
Figure 2.
Comparison of the products formed by the digestion of the substrate shown in Fig. 1 with WT lysozyme and mutant T26H. (a) Substrate alone. (b) Digestion of 2 × 10⁻⁶ M substrate by 8 × 10⁻⁸ M WT* lysozyme for 5 min at 25°C (14). (c) Digestion of 2 × 10⁻⁶ M substrate by 5 × 10⁻⁷ M T26H for 5 min at 25°C (14). (d) Digestion of 8 × 10⁻⁵ M substrate by 5 × 10⁻⁷ M T26H for 60 min at 0°C. See text for additional details and explanation of peaks.

