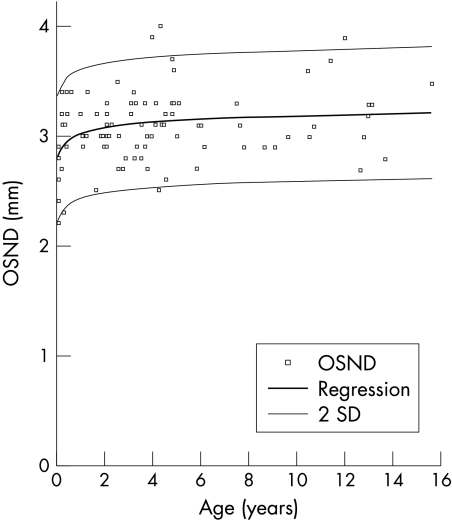
Figure 2.
Optic nerve sheath diameters of those in group 1 plotted in relation to age. Logarithmic regression line of ONSD with age. Logarithmic regression (± 2 SD) illustrating 95% confidence interval. (Reproduced with permission of Harcourt Health Services and Ballantyne et al.3)

