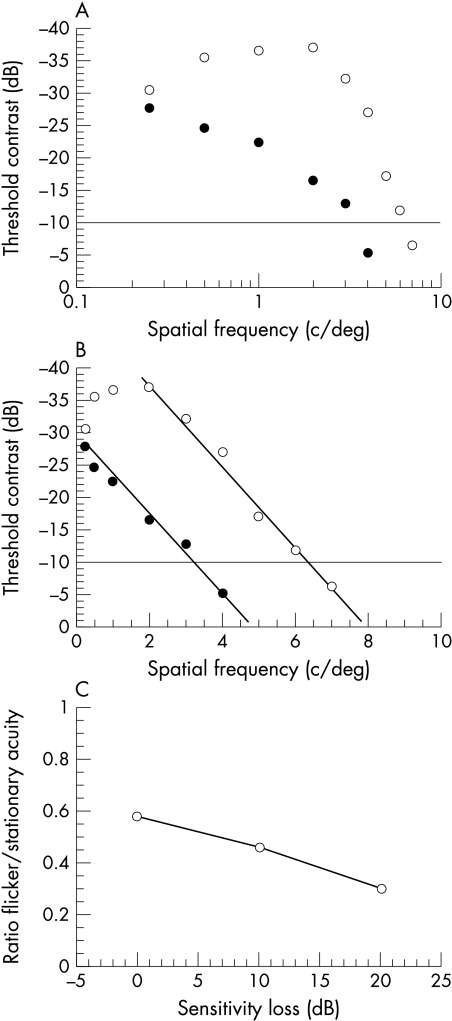
Figure 3.
Graphs demonstrating that non-selective loss can account for the change in contrast sensitivity ratios between the M and P cell pathways. Contrast sensitivity functions (CSF) have been plotted for stimuli that are either stationary (open circles) or counterphase flickered (solid circles) observed by a single, representative (non-glaucomatous) observer. (A) shows that with logarithmic axes, the slope for the loss of sensitivity at high spatial frequencies differs for the two stimuli. (B) shows matching slopes for the two stimuli when plotted on linear axes. (C) The change in the ratio of acuity for moving and stationary stimuli arises from the relative shape of the contrast sensitivity functions for these stimuli in the normal eye.

