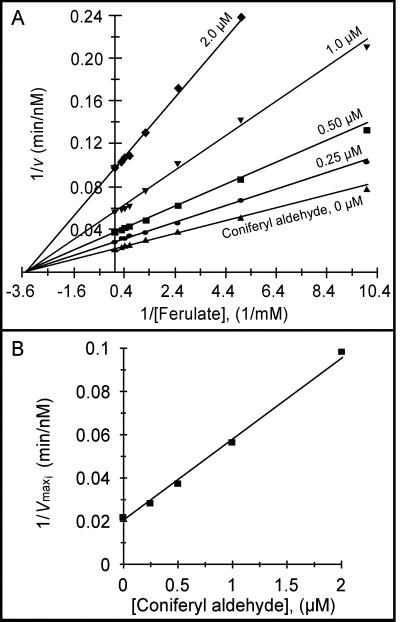
Figure 3.
(A) Lineweaver–Burk plot of CAld5H-catalyzed ferulate 5-hydroxylation in the presence of coniferyl aldehyde at different concentrations (as shown). Ferulate concentrations: 100 to 3,200 μM. (B) A replot of 1/Vmaxi for each reciprocal plot (in A) vs. the corresponding coniferyl aldehyde (inhibitor) concentration at which it was obtained. Slope = 1/Vmax Ki.

