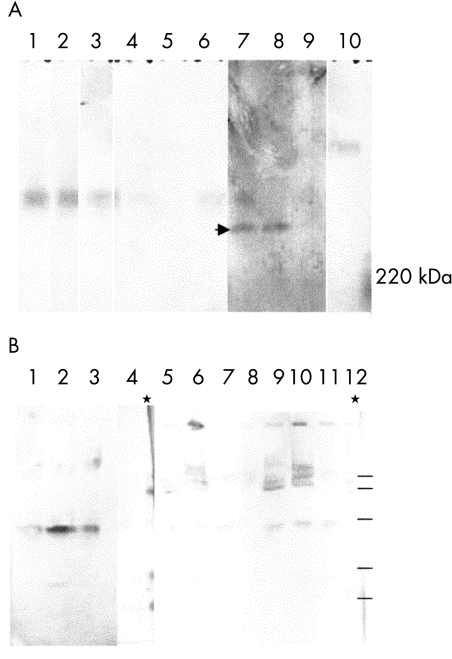
Figure 4.
Electrophoretic profiles of mucins incubated with bacteria. (A) Agarose gel electrophoresis of mucins 1.3–1.35 g/ml, followed by vacuum blotting on Immobilon and cross reaction with WGA. Lanes 1–3: Vo, Vi, Vt controls; lanes 4–6 Vo, Vi, Vt incubated with 21Ch; lanes 7–9: Vo, Vi, Vt incubated with 3A; lane 10 bacteria. Arrowhead indicates the novel high mobility degradation bands. (B) Polyacrylamide gel electrophoresis followed by electroblotting on Immobilon and cross reaction with WGA. Lanes 1–8 mucins 1.3–1.35 g/ml: Vi incubated with 1B (lane 1), 3A (lane 2), and 21Ch (lane 3); Vi control and rainbow markers (lane 4); Vt incubated with 1B (lane 5), 3A (lane 6), and 21Ch (lane 7), Vt control (lane 8). Lanes 9–12: mucin 1.2–1.3 g/m Vo: incubated with 1B (lane 9), 3A (lane 10) and 21Ch (lane 11), Vo control (lane 12). The 1.2–1.3 g/ml buoyant density would contain glycoproteins other than mucins. This blot indicates that after hydrodynamic volume fractionation few non-mucin glycoproteins are present in the Vo.

