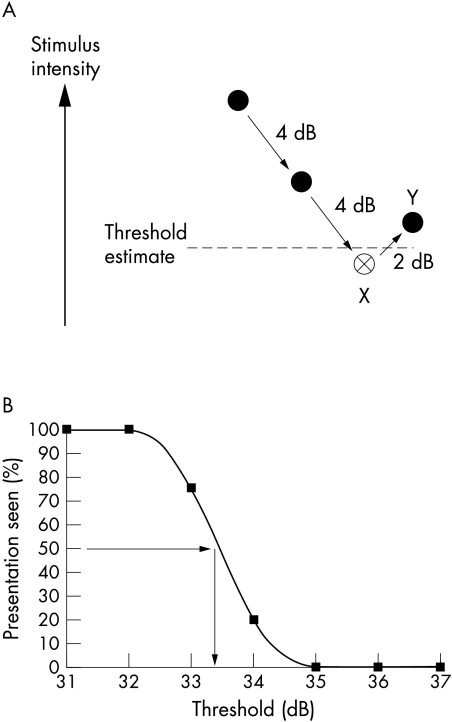
Figure 1.
(A) The staircase strategy. Solid circles represent “not seen” stimuli and open circles “seen” stimuli. This threshold estimation strategy uses 4 dB increments until the first reversal of response (X) and then 2 dB steps until the second reversal (Y). This staircase is similar to the full threshold strategy used by commercial instrumentation excepting that it uses the mean value to the two reversals to define the threshold estimate (broken line), rather than the “last seen” end point used with full threshold. (B) A frequency of seeing curve derived from fitting data obtained with the method of constant stimuli with a cumulative Gaussian function. The 50% detection level (horizontal arrow) is used to extrapolate the “real” or gold standard threshold measurement (vertical arrow).

