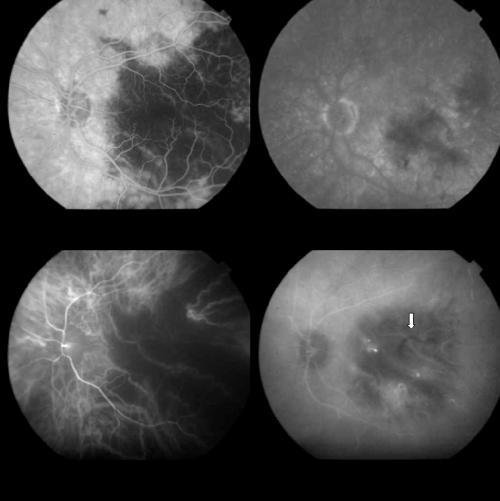
Figure 5.
Same case as Figure 4, 1 week after PDT. Top left: FA at 2 minutes showing the marked choroidal delayed perfusion at the posterior pole, extending beyond the laser spot, especially towards the temporal sector. Top right: Late FA phases (12 minutes) showing the delayed filling of the choroid. Bottom left: Early ICGA phase (5 minutes) showing the delayed choroidal perfusion. Bottom right: ICGA at 10 minutes. The occlusion of the ciliary artery (arrow) is still detectable whereas three hot spots along with some choroidal vessel staining appear.

