Abstract
Background/aims: The interpretation of high contrast retinal nerve fibre layer (RNFL) images in glaucoma can be confounded by the presence of image blur; it can be difficult to discern diffuse axon loss in a poor quality image. One solution is to provide an objective measure of the image quality based on features in the image other than the RNFL. In this study the authors have developed an objective method to quantify the clarity of RNFL images, comparing it with a subjective image grading system.
Methods: Digitally acquired, monochrome retinal images were taken from 58 eyes (one image per eye) with a Topcon 50 IX retinal camera. Image resolution was 1320 × 1032 pixels at 8 bits per pixel. Image sharpness was subjectively graded by two masked experienced observers on a scale 1 to 5 relative to a reference set of RNFL images. Software algorithms were developed using Matlab (5.2) to calculate the acutance, an objective measure of the physical characteristics that underlie the subjective impression of sharpness in an image.
Results: Acutance values could be calculated for all the images. The Pearson correlation coefficients of the log of the acutance for each image and the subjective grades of observer 1 and observer 2 were 0.90 (p<0.001, n=58) and 0.84 (p<0.001, n=58) respectively.
Conclusions: These data suggest that acutance may provide a useful objective measure of image quality, which correlates well with the subjective impression of the digital retinal image sharpness. Objective measures of image quality should help in the discrimination of diffuse retinal nerve fibre loss from image blur in patients with diffuse glaucomatous damage.
Keywords: retinal nerve fibre layer, glaucoma, optic disc, digital imaging
The early detection of retinal damage is central to the effective management of patients with glaucoma. The demonstration that defects in the retinal nerve fibre layer (RNFL) can precede the development of visual field defects in glaucoma patients by several years stresses the importance of RNFL examination in the early diagnosis of glaucoma.1–4 This has led to the development of photographic methods of RNFL examination for which qualitative and quantitative analyses have enabled clinically useful methods for detecting RNFL damage.4–10 However, several factors limit the clinical application of this technique. Firstly, it depends on the skill and expertise of the examining clinician and, secondly, on the quality of the RNFL image.
A RNFL image is usually taken using black and white film with a blue excitation filter to provide a high contrast monochromatic image.11 While this method has been successful in detecting glaucomatous damage especially when the defect is focal,5–8,12 image quality remains a limiting factor. In the normal eye, identification of the RNFL requires clear ocular media and a correct focus setting. In glaucomatous eyes, if these factors are not optimal, it may not be possible to ascribe any reduction in visibility of the RNFL to a loss of retinal ganglion cell axons. For the identification of focal RNFL damage, this problem can, to some extent, be overcome by comparison with surrounding retinal nerve fibre layer. Unfortunately, this solution is not feasible for the detection of diffuse loss which is the most common pattern of damage in glaucoma.12
The subjective impression of the quality of an RNFL image depends on several factors such as the clarity of blood vessels, optic disc, and RNFL striations. The clarity of the optic disc features varies, as the disc often does not lie in the same focal plane as the RNFL. Hence even when the disc features are clear, the RNFL may not be in sharp focus. In some cases, poor quality images have been excluded from studies on the basis of a subjective quality assessment,8,10,13 which can introduce bias and limit clinical application. Ideally, the assessment of image quality should be based on ocular features other than the retinal nerve fibre layer since this will change as a function of the degree of glaucoma damage.
Since digital retinal imaging is now replacing conventional fundus photography the quantitative analysis of retinal images is a practical option and has the potential of providing an objective measure of image quality.14,15 With this prospect in mind, we developed a software algorithm to quantify the quality of the digital RNFL images. As a first step in determining the clinical utility value of this method, we report the level of agreement achieved between this objective grading system and the subjective grading of independent observers.
PATIENTS AND METHODS
Fifty eight digitally acquired RNFL images of varying quality were selected consecutively from the hospital imaging archive. Both normal and glaucoma patients were included. In each case, written, informed consent was provided by each patient in accordance with the guidelines of the University Hospital of Wales. All images were acquired in the course of the patients’ routine clinical care either as a glaucoma patient or following referral to the glaucoma service to establish the diagnosis of glaucoma.
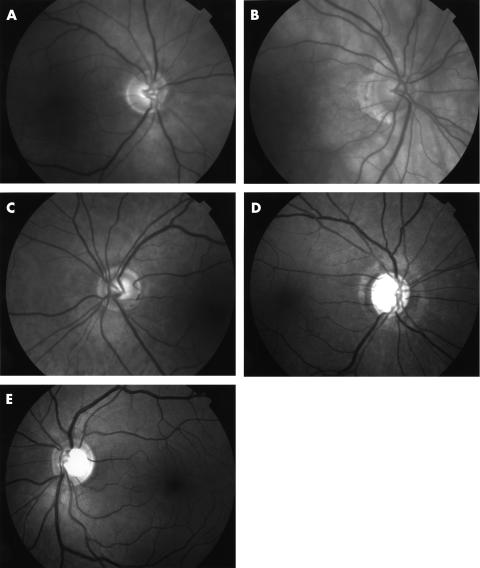
Images were digitally captured using a Topcon 50 IX retina camera at a resolution of 1320 × 1032, 8 bits per pixel (grey scale) and stored in uncompressed, tagged image file format (TIFF). The images were displayed singly on a 17 inch Sony Multiscan G400 computer monitor screen (Sony Corporation, Japan) at 100% magnification using Imaging for Windows 98 (Microsoft Corporation, USA). Two masked and experienced observers graded the quality of each of the images sequentially as they are displayed, using an ordinal system (1 to 5, in which 1 representing a poor quality image and 5 representing a good quality image (Table 1)). Each observer had access to the set of five reference images representing the varying image quality during the grading process (Fig 1A–E). The observers were instructed to compare each of the images with the reference set with particular attention paid to the clarity of the retinal veins 1 disc diameter from the disc margin. Since RNFL striations are often reduced or absent in glaucoma, the clarity of RNFL striations was not used as a criterion to provide a subjective grading of image quality.
Table 1.
Grade of the quality of RNFL images
| Quality | Grade |
| Bad | 1 |
| Moderately bad | 2 |
| Moderate | 3 |
| Moderately good | 4 |
| Good | 5 |
Figure 1.
(A) Example of a poor quality image (grade 1). (B) Example of a moderately bad quality image (grade 2). (C) Example of a moderate quality image (grade 3). (D) Example of a moderately good quality image (grade 4). (E) Example of a good quality image (grade 5).
To provide an objective value of image sharpness the acutance value of an area across a blood vessel was calculated. Acutance is an objective measure of the physical characteristics that underlie the subjective impression of sharpness in an image. It was introduced in the 1940s following the realisation that the ability to resolve fine details in an image does not necessarily correlate with the image quality of objects in general. In brief, it is based on an analysis of the intensity distribution across the image of a knife edge and includes the effects of any non-linearity. Regions far away from the geometrical edge image are excluded so that the regions of very low gradient do not weight the results (the intensity distribution between adjacent points is smaller in regions further away from the knife edge resulting in lower gradient).16,17 Acutance has found application in other branches of medicine—for example, in quantifying the sharpness of the boundaries of tumours which, has been helpful in the discrimination between benign and malignant mammographic tumours.18
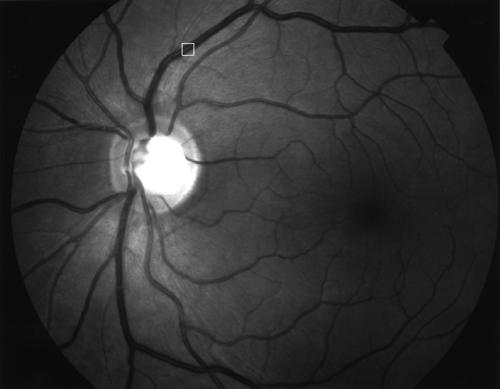
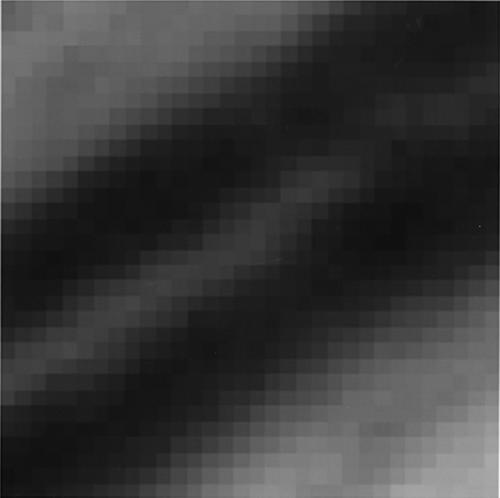
For each of the 58 images, we selected a square region, measuring 32 × 32 pixels, across the superotemporal vein approximately 1 disc diameter from the edge of the optic disc (Figs 2 and 3). The clarity of the blood vessel in this region was determined from the acutance value associated with this region of the image.
Figure 2.
Example of an RNFL image and the selected region (32 × 32 pixels) of interest.
Figure 3.
Magnified image of the selected region (32 × 32 pixels) of interest.
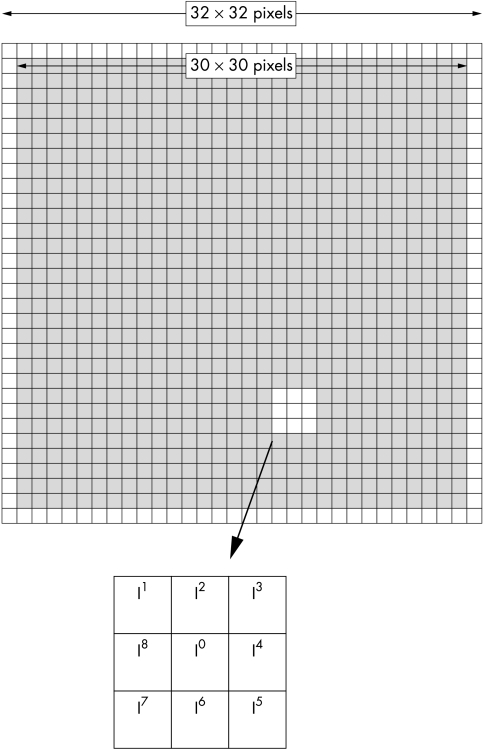
The principle of acutance calculation is shown in Figure 4. Each region of interest (ROI) consists of a grid of 32 × 32 pixels in which an “inner” 30 × 30 pixel grid comprising 900 pixels, each surrounded by 8 adjacent pixels. The pixels are assigned an 8 bit grey scale value, ranging from 0 (pure black) to 255 (pure white). Within the 30 × 30 square, the difference in the grey scale value between the centre pixel and each of the 8 surrounding pixels (ΔI) is calculated and is divided by ΔX, where ΔX is the distance between the pixels of interest. Since the pixels are adjacent to each other, ΔX is equal to 1. The resultant values are squared and summed and then normalised by dividing by the total number of contributing values (n)—that is, 30 × 30 × 8 (since there are 30 × 30 pixels and each pixel has 8 adjacent pixels) and two times the squared mean value of the test image (I0). The test image consists of alternating values of 0 and 255 and has a calculated acutance value of 1. Finally, the acutance values are multiplied by 104 to facilitate comparison between images.
Figure 4.
Schematic diagram showing 32 × 32 pixels area of interest with an inner 30 × 30 pixels square (shaded).
 |
 |
 |
The acutance is given as:
 |
Since the determination of acutance is computationally intensive, we used a subset of the pixels (lying within the region of interest) to facilitate its rapid calculation. Software algorithms were developed (Matlab Version 5.2, The Math Works Inc, MA, USA) to calculate the acutance value of the area of interest in a semiautomated fashion. Statistical analysis was performed using spss 9.0, SPSS Inc, Chicago, IL, USA).
RESULTS
Fifty eight images from 58 eyes from 39 patients (20 females and 19 males) were obtained from the hospital glaucoma image database. The mean age of the patients was 61.5 (SD 15.6) years and did not differ significantly between normal (64.8 (15.5)) and glaucomatous patients (60.0 (16.0)) (p=0.14); 40% were fundal images from the right eye; 23 (40%) discs were normal and 35 (60%) were glaucomatous.
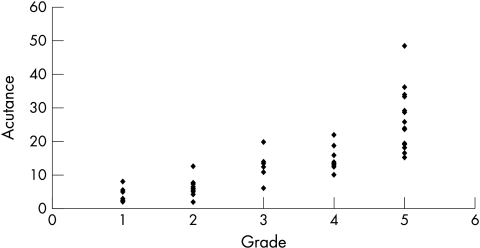
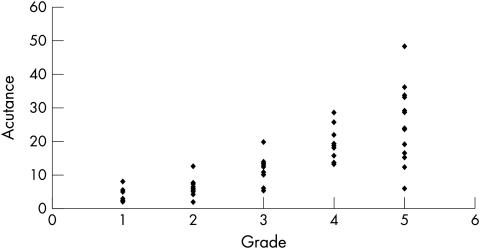
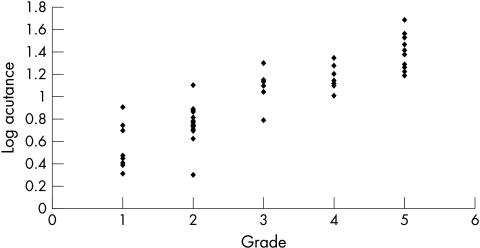
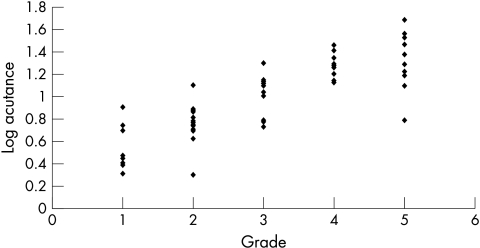
The mean acutance value for all the eyes was 13.5 (SD 10.3, range 1.98–48.58). When the calculated acutance values were plotted against the grading of observer 1 and observer 2, it was found to be in logarithmic progression (Figs 5 and 6). The log of acutance values was therefore calculated to give a linear relation with the observers’ grading (Figs 7 and 8). The corresponding mean log of acutance was 1.00 (SD 0.35, range 0.30–1.69). There was no difference between the mean log of acutance in normal eyes (1.02, SD 0.34, range 0.70–1.56) and glaucomatous eyes (1.01, SD 0.34, range 0.41–1.69) (two tail unpaired t test p=0.87). The mean grading of observer 1 and observer 2 were 3.09 (SD 1.48, range 1–5) and 3.05 (SD 1.44, range 1–5) respectively. The Pearson correlation coefficient of the grading of observers 1 and 2 (r0) was 0.94. The Pearson correlation coefficients of the log of the calculated acutance values for each image and the grading of observer 1 and observer 2 were 0.90 (p<0.001, n=58) and 0.84 (p<0.001, n=58) respectively.
Figure 5.
Acutance v rank of observer 1.
Figure 6.
Acutance v rank of observer 2.
Figure 7.
Log acutance v rank of observer 1.
Figure 8.
Log acutance v rank of observer 2.
DISCUSSION
We found a good correlation between the log acutance values for the RNFL images and the subjective grading of the image sharpness by two masked and experienced observers. Our results suggest that acutance may form the basis of a practical method for providing an objective assessment of digital RNFL images and may reduce the dependence of the analysis system on expert observation. The provision of acutance values for RNFL image should improve confidence in the assessment of RNFL. For example, if an RNFL image has a high acutance value (that is, good quality) and there is an absence of RNFL striations, one may be more confident in attributing the lack of RNFL striations to true axon loss rather than just secondary to suboptimal image quality.
The use of manual RNFL analysis should be placed in the context of other methods for the quantitative analysis of the optic disc and RNFL. Although devices such as the scanning laser ophthalmoscope (Heidelberg Retina Tomograph, Germany) and the retinal nerve fibre layer analyser (GdX, Laser Diagnostic Technologies, USA) have been used to diagnose glaucoma with high diagnostic precision,19,20 this has not consistently been achieved by all groups.21,22. It is likely that the highest levels of diagnostic accuracy will be achieved using a combination of imaging techniques (both subjective and objective).23 These analyses do not need to be applied in all cases but in those in which the diagnosis or the presence of progressive disease remains equivocal. Our study employed filters that are currently available in digital fundus camera, which should encourage the use of RNFL image analysis in this clinical approach.
It is important to note that the acutance value calculated and the subjective grading of image quality were not based on the clarity RNFL striations as this is affected by the degree of glaucomatous damage.1–4,12 This is especially true in glaucomatous diffuse loss as the actual reduction in RNFL striations may confound the calculation of the acutance value and subjective grading.
There exists a possibility that the degree of RNFL loss might have an effect on the acutance by increasing the edge effect of pixels representing a vein edge. As there is no reliable objective or subjective method for providing an absolute measure of RNFL loss, we investigated whether there is any correlation between cup:disc ratio (an indirect way of indicating the extent of RNFL loss) and the acutance and the subjective assessment of image clarity as graded by the observers. We have biomicroscopic cup:disc ratio (CDR) data on 53 of the 58 images. There was no significant correlation between CDR and acutance (Pearson correlation efficient, r= 0.002, p>0.05), CDR and log acutance (r=0.05, p>0.05), CDR and observer 1 (r=0.13, p>0.05), and CDR and observer 2 (r=0.05, p>0.05). In addition, we divided the images into two groups, group A (log acutance D 1.00, n=28) and group B (log acutance <1.00, n=25). There was no significant difference between the mean CDR of group A (0.64; SD 0.16; range 0.40–0.95) and group B (0.63; SD 0.23; range 0.20–0.90) (two tailed unpaired t test, p=0.86). Therefore, we can infer that the degree of RNFL loss does not have a major effect on the acutance or observer grading.
Since we sampled a single location in the image, the question arises as to whether this provides a satisfactory estimate of the entire image quality. Our choice of sampling region was made on preliminary observations using other retinal regions. Although these regions provided a reasonable correlation with subjective assessment, we found a higher degree of variability. Furthermore, the areas of interest in the assessment of RNFL were near the optic disc and along the vascular arcades and not at the periphery, which were often not in sharp focus and/or poorly illuminated even in good quality images.
Although this method holds promise as a practical technique, it has several limitations. Firstly, the selection of the region of interest was done subjectively although we took steps to reduce the subjectivity by clearly defining the area (that is, the superotemporal vein, 1 disc diameter from the edge of the optic disc) and standardising it to all the images. However, owing to natural variations of the retinal vasculature, the selection of the region of interest remains just an approximation. Secondly, the images were monochrome and not truly red free. We could expect better results with different filter settings. Thirdly, although the observers were instructed not to consider the clarity of the RNFL striations in their grading, the degree of the RNFL striations might still influence their subjective grading.
Despite the limitations, there are potential clinical applications of this technique. Routine use of acutance could provide a useful measure of quality control of RNFL images. The “cut-off” acutance value of RNFL images could be predetermined so that only images with acutance above this value would be considered of sufficiently good quality for RNFL analysis. Since our software algorithm is semiautomated it could easily be incorporated into digital imaging program allowing efficient automated objective assessment of the quality of RNFL images. These quantitative measures should help in identification of diffuse glaucomatous damage, based on the assessment of digital RNFL images.
Presented in part at the Association for Research in Vision and Ophthalmology, Fort Lauderdale, FL, USA, May 2001.
REFERENCES
- 1.Hoyt WF, Frisen L, Newman NM. Fundoscopy of nerve fiber layer defects in glaucoma. Invest Ophthalmol 1973;12:814–29. [PubMed] [Google Scholar]
- 2.Sommer A, Miller NR, Pollack I, et al. The nerve fiber layer in the diagnosis of glaucoma. Arch Ophthalmol 1977;95:2149–56. [DOI] [PubMed] [Google Scholar]
- 3.Sommer A, Katz J, Quigley H. Clinically detectable nerve fiber layer atrophy precedes the onset of glaucomatous field loss. Acta Ophthalmol 1991;109:77–83. [DOI] [PubMed] [Google Scholar]
- 4.Sommer A, Quigley H, Robin A, et al. Evaluation of nerve fiber layer assessment. Arch Ophthalmol 1984;102:1766–71. [DOI] [PubMed] [Google Scholar]
- 5.Quigley H, Addicks E. Quantitative studies of retinal nerve fiber layer defects. Arch Ophthalmol 1982;100:807–14. [DOI] [PubMed] [Google Scholar]
- 6.Quigley HA, Sommer A. How to use nerve fiber layer examination in the management of glaucoma. Trans Am Ophthalmol Soc 1987;85:254–72. [PMC free article] [PubMed] [Google Scholar]
- 7.Quigley HA, Katz J, Derick RJ, et al. An evaluation of optic disc and nerve fiber layer examinations in monitoring progression of early glaucoma damage. Ophthalmology 1992;99:19–28. [DOI] [PubMed] [Google Scholar]
- 8.Quigley H, Reacher M, Katz J, et al. Quantitative grading of nerve fiber layer photographs. Ophthalmology 1993;100:1800–7. [DOI] [PubMed] [Google Scholar]
- 9.Jonas JB, Dichtl A. Evaluation of the retinal nerve fiber layer. Surv Ophthalmol 1996;40:369–78. [DOI] [PubMed] [Google Scholar]
- 10.Niessen A, van den Berg T. Evaluation of a reference set based grading system for retinal nerve fibre layer photographs in 1941 eyes. Acta Ophthalmol Scand 1998;76:278–82. [DOI] [PubMed] [Google Scholar]
- 11.Airaksinen PJ, Nieminen H. Retinal nerve fiber layer photography in glaucoma. Ophthalmology 1985;92:877–9. [DOI] [PubMed] [Google Scholar]
- 12.Airaksinen PJ, Drance SM, Douglas GR, et al. Diffuse and localized nerve fiber loss in glaucoma. Am J Ophthalmol 1984;98:566–71. [DOI] [PubMed] [Google Scholar]
- 13.Niessen A, van den Berg T, Langerhorst C, et al. Grading of retinal nerve fiber layer with a photographic reference set. Am J Ophthalmol 1995;120:577–86. [DOI] [PubMed] [Google Scholar]
- 14.Peli E, Hedges T, Schwartz B. Computerized enhancement of retinal nerve fiber layer. Acta Ophthalmol 1986;64:113–22. [DOI] [PubMed] [Google Scholar]
- 15.Tuulonen A, Alanko H, Hyytinen P, et al. Digital imaging and microtexture analysis of the nerve fiber layer. J Glaucoma 2000;9:5–9. [DOI] [PubMed] [Google Scholar]
- 16.Williams G. Tutorial: Image quality—acutance. In: Pixel Vision, Inc, 1995.
- 17.The focal encyclopedia of photography. Revised desk edition. January 1969 ed. London: Focal Press, 1975.
- 18.Rangayyan RM, El-Faramawy NM, Desautels JE, et al. Measures of acutance and shape for classification of breast tumors. IEEE Trans Med Imaging 1997;16:799–810. [DOI] [PubMed] [Google Scholar]
- 19.Wollstein G, Garway-Heath DF, Hitchings RA. Identification of early glaucoma cases with the scanning laser ophthalmoscope. Ophthalmology 1998;105:1557–63. [DOI] [PubMed] [Google Scholar]
- 20.Tjon-Fo-Sang MJ, Lemij HG. The sensitivity and specificity of nerve fiber layer measurements in glaucoma as determined with scanning laser polarimetry. Am J Ophthalmol 1997;123:62–9. [DOI] [PubMed] [Google Scholar]
- 21.Miglior S, Casula M, Guareschi M, et al. Clinical ability of Heidelberg retinal tomograph examination to detect glaucomatous visual field changes. Ophthalmology 2001;108:1621–7. [DOI] [PubMed] [Google Scholar]
- 22.Zangwill LM, Bowd C, Berry CC, et al. Discriminating between normal and glaucomatous eyes using the Heidelberg Retina Tomograph, GDx Nerve Fiber Analyzer, and Optical Coherence Tomograph. Arch Ophthalmol 2001;119:985–93. [DOI] [PubMed] [Google Scholar]
- 23.Greaney MJ, Hoffman DC, Garway-Heath DF, et al. Comparison of optic nerve imaging methods to distinguish normal eyes from those with glaucoma. Invest Ophthalmol Vis Sci 2002;43:140–5. [PubMed] [Google Scholar]


