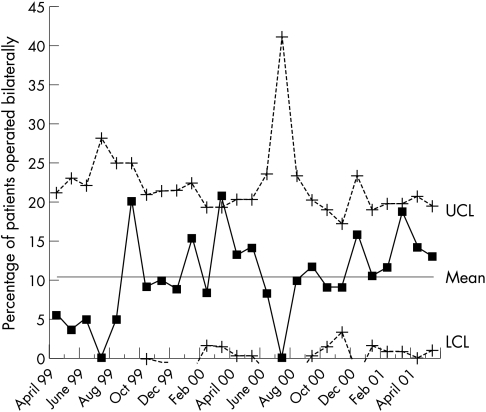
Figure 3.
Percentage of patients undergoing bilateral surgery during the study period, monitored month by month. The graph is a control chart, used for monitoring process function over time. UCL = upper control limit. LCL = lower control limit (only values ≥0 are plotted). Overall mean percentage of bilaterally operated patients during the study period was 10.5%. The control chart does not suggest any significant shift in the process over time after the initial 5 months.

