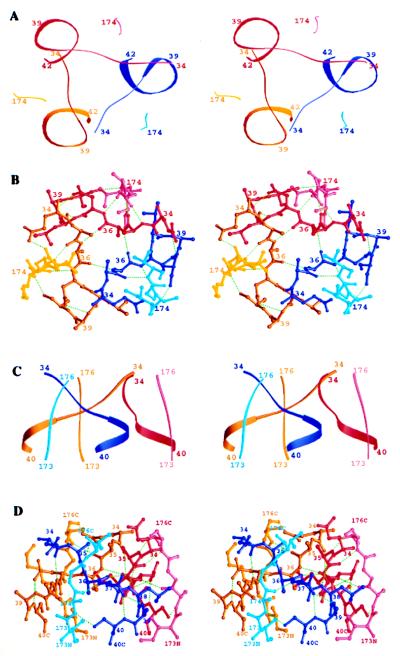
Figure 4.
N cap domain of EHA2(23–185). (A) Stereo ribbon diagram of the N-terminal residues (dark blue, dark red, dark yellow) and the C-terminal residues (light colors) of EHA2 (23–185), viewed down the molecular threefold-symmetry axis. (B) Stereoatomic diagram of the N-terminal residues (colors and view as in A) and the C-terminal residues of EHA2 (23–185). Potential hydrogen bonds are green dashed lines. (C) Stereoribbon diagram as in A but viewed perpendicular to the molecular threefold-symmetry axis. (D) Stereoatomic diagram as in B but viewed as in C. Figure prepared with ribbons (43).

