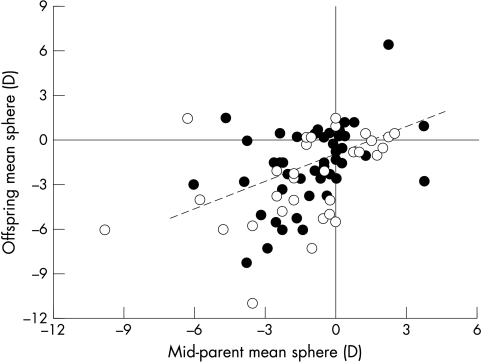
Figure 1.
Correlation in ocular refraction between parents and offspring. All data are from right eyes only. Mid-parent values are the average mean spherical equivalent for both parents (solid symbols; n=49), or the value for a single parent when a prescription was available for only one parent (open symbols; n=31). Spearman correlation coefficient r = 0.482 (n=80; p<0.0001). The broken line shows the linear regression (b=0.31) for the 49 families for which data were available for both parents.

