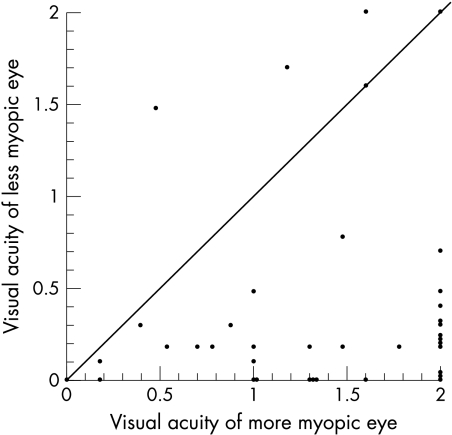
Figure 4.
Visual acuity of the more myopic eye is compared with the visual acuity of the less myopic eye in 40 patients. Visual acuity is expressed as the logarithm of the maximal angle of resolution (logMAR). Acuities of 20/2000 or less were arbitrarily assigned log MAR values of 2.0. The diagonal line represents the total distribution of interocularly identical acuities. Note that single circles located on the x-axis at the value 2, and on the y-axis at 0.1 and 0.4 represent two pair of patients with identical acuities.

