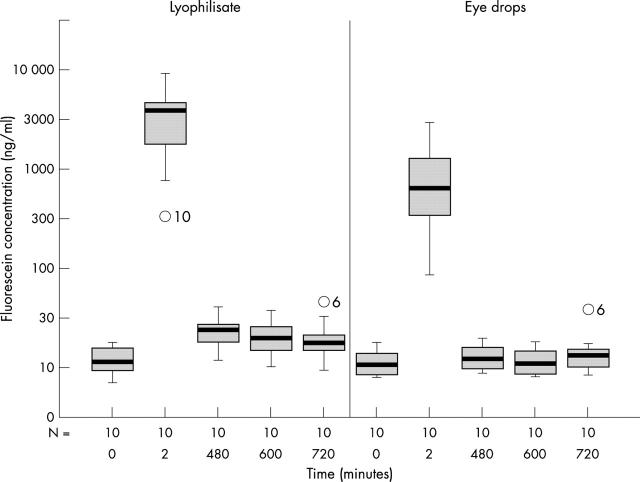
Figure 5.
Fluorescein concentration flow over time in the cornea: lyophilisate v eye drop; Box plot diagrams: the horizontal lines in the box denote the 25th, 50th, and 75th percentile values. The error bars denote the 5th and the 95th percentile values. The square symbol in the box shows the mean of the data column.

