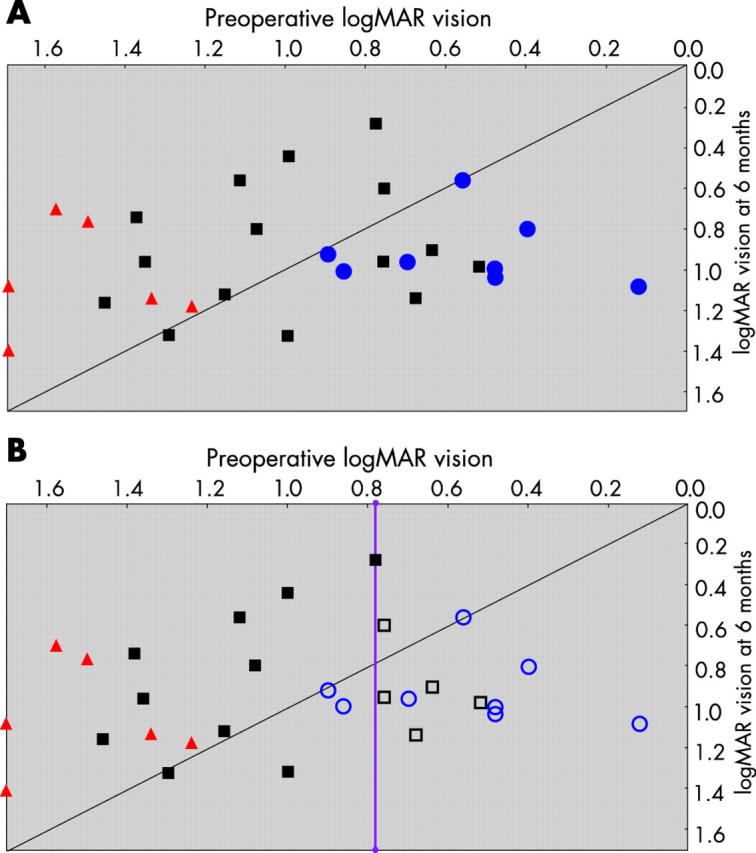
Figure 2.

(A) A plot of preoperative against six months logMAR visual acuity. Red triangles, haemorrhagic lesions; black squares, predominantly classic lesions; blue circles, minimally classic lesions. The diagonal line is the line of no change. Patients with improvement are shown above and to the left of this line. (B) The same plot showing selection of patients. The vertical line is the preoperative visual cut off of 0.78. Patients to the left of this line are selected. Solid symbols, patients selected; empty symbols, patients not selected. By selecting all predominantly classic and haemorrhagic cases with a preoperative vision of 0.78 or worse, all patients with visual improvement are included and all but two patients with visual deterioration are excluded.
