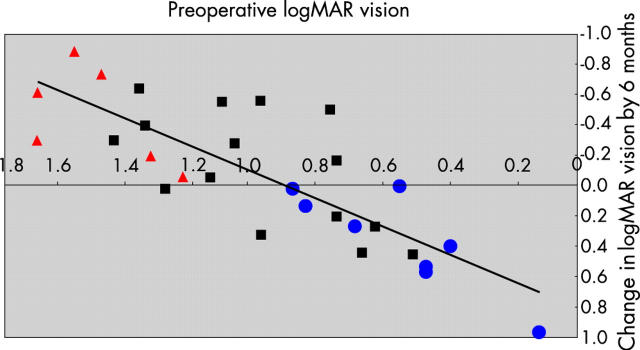
Figure 4.
Plotting change in logMAR visual acuity against preoperative logMAR visual acuity. Note with logMAR vision any improvement is negative. Thus, patients above the x axis had improvement and below had deterioration. The trend line has a negative slope, suggesting that the worse the preoperative vision, the greater the improvement.

