
Figure 2.
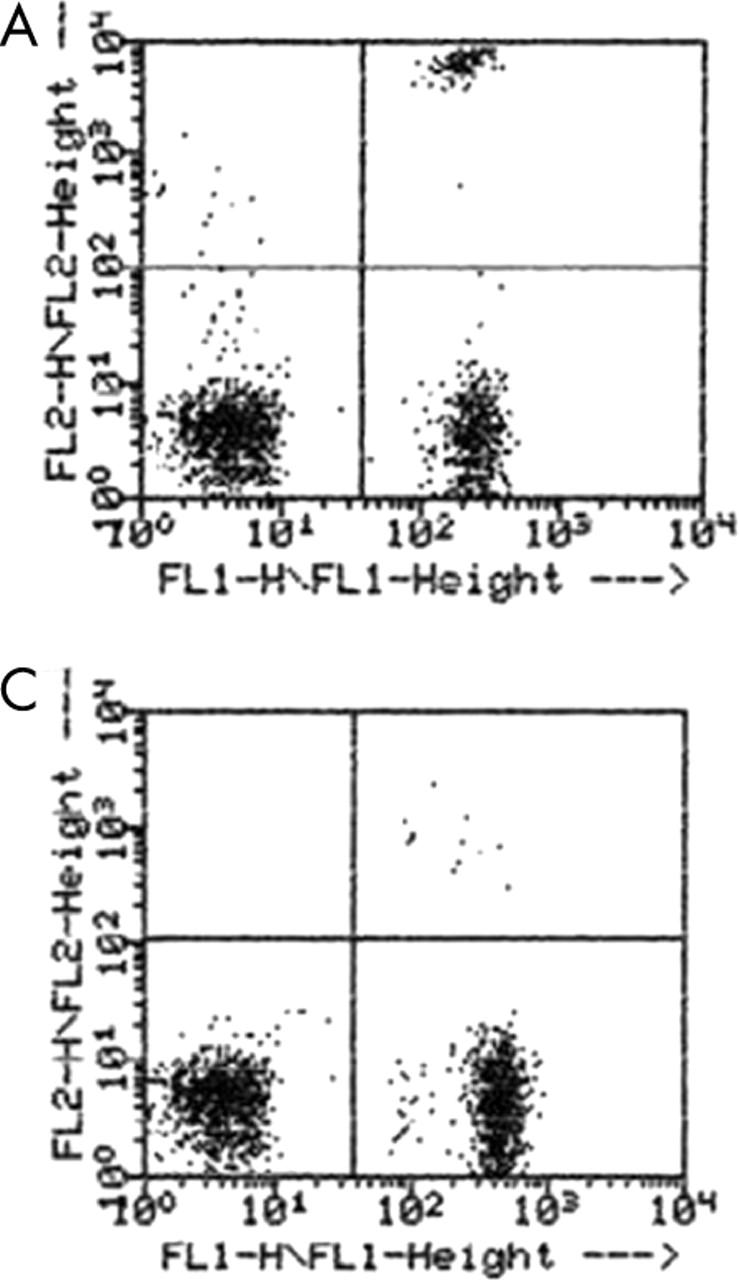
Cells were cultured, harvested, and stained for CD8 and HML-1 as described in the methods. Flowcytometry dot plots for groups A and C are shown. There is significant increase in fluorescence intensity in the positive cells (data presented is from one significant experiment out of eight).