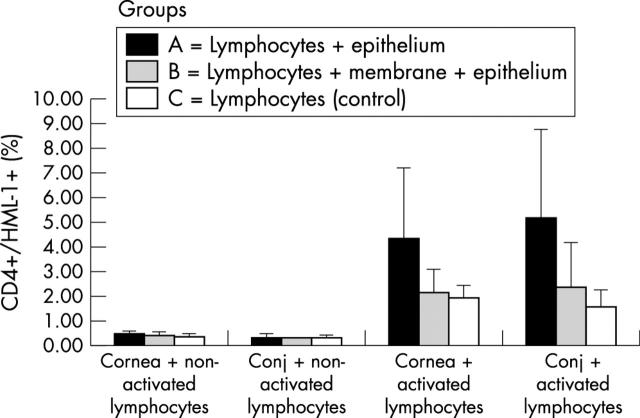
Figure 3.
Means and standard deviations of CD4+/HML-1+ lymphocytes expressed as a percentage of the total gated lymphocyte population for groups A, B, and C in the different experimental conditions. Number of samples: Cornea + non-activated lymphocytes; A = 3; B = 3; C = 3 Conj + non-activated lymphocytes; A = 3; B = 3; C = 3; Cornea + activated lymphocytes; A = 4; B = 4; C = 4; Conj + activated lymphocytes; A = 6; B = 6; C = 6.

