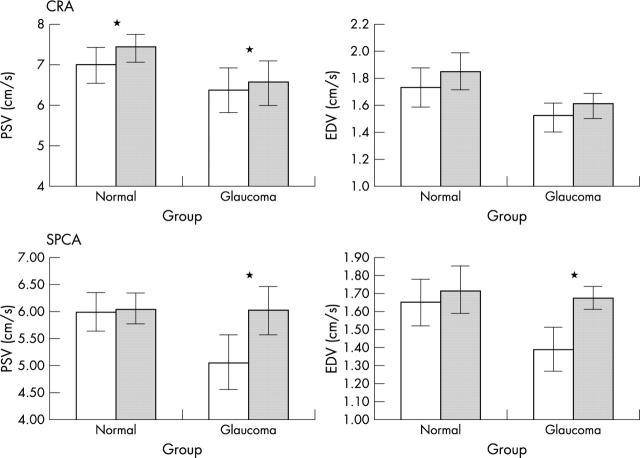
Figure 1.
Histograms showing the mean (SD) peak systolic velocity (PSV) and end diastolic velocity (EDV) in the central retinal artery (CRA) and short posterior ciliary arteries (SPCAs) for normal subjects and glaucoma patients at baseline (open) and in response to hypercapnia (solid). *Significant effects where p<0.05.

