
Figure 6.
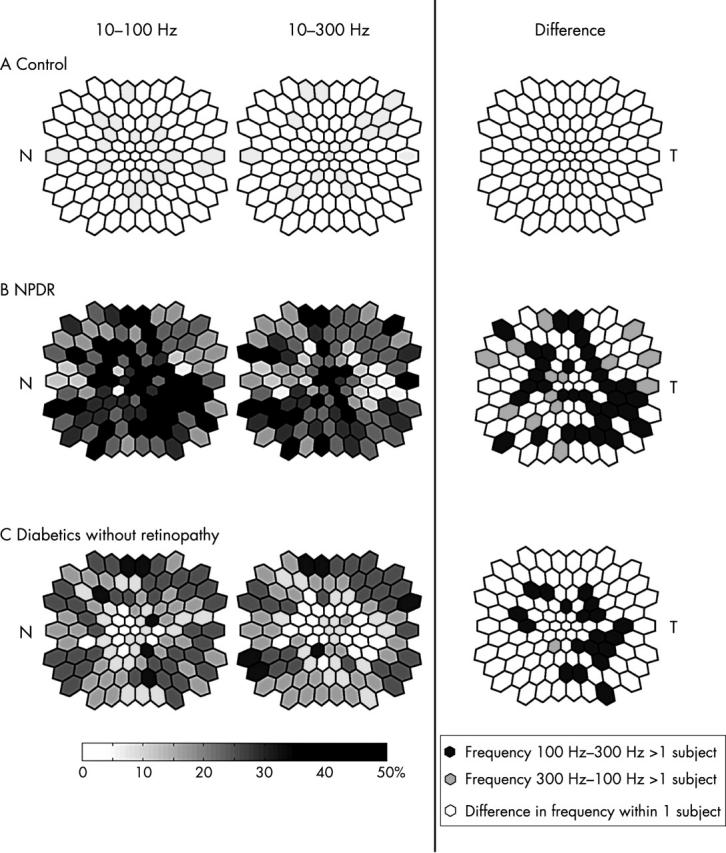
Frequency plots of abnormal implicit times (retinal views, left eye orientations): For the left and middle columns, the shading in each stimulus location represents the percentage of subjects with abnormal implicit times. The darker the shading, the greater the percentage of subjects with abnormalities. The right column indicates the difference in frequency of abnormalities between the two channels. Solid hexagons indicate retinal locations where more patients had abnormalities in the 10–100 Hz channel than the 10–300 Hz channel. Shaded hexagons show more patients with abnormalities in the 10–300 Hz channel than the 10–100 Hz channel. (A) For the normal subjects, the maximum frequency is 5% for both channels. (B) For the NPDR patients, the maximum frequency is 52.9% in the 10–100 Hz channel and 47% in the 10–300 Hz channel. Broader retinal areas in the 10–100 Hz map have high frequencies of abnormalities than in the 10–300 Hz channel, especially in the inferior temporal quadrant. (C) For the diabetics without retinopathy, in both channels the maximal frequency is 33.3%. The 10–100 Hz channel also has broader retinal areas associated with high frequency of abnormalities. N = nasal retina; T = temporal retina.