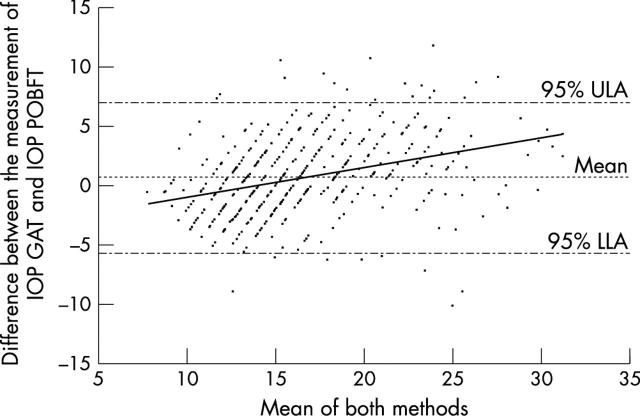
Figure 5.
A Bland-Altman bias plot comparing intraocular pressure (IOP) measurement obtained by the pulsatile ocular blood flow tonograph (POBFT) with the Goldmann applanation tonometer (GAT). Results are shown for 479 subjects. The trend line indicates that when compared to the GAT the POBF tonograph underestimates IOP at lower IOPs and overestimates IOP at higher IOPs (equation 4).

