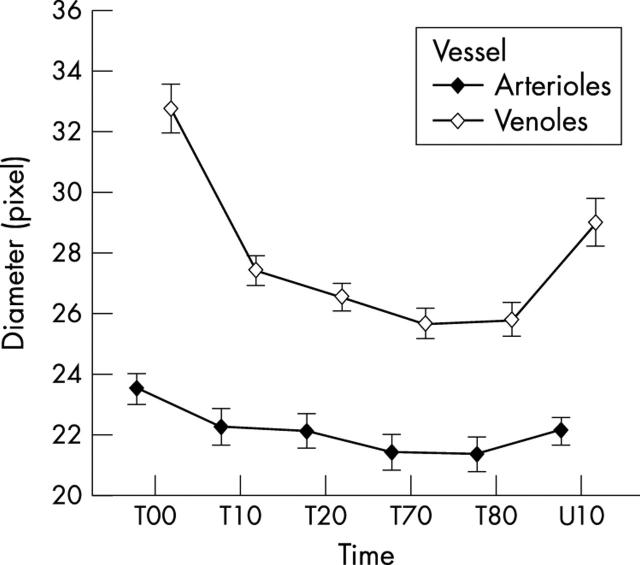
Figure 3.
Mean diameter for the vessels and standard error of the mean for all patients during HO: T00 is the time of the beginning of the treatment. T10, T20, T70, and T80 show the diameter of the vessels after 10, 20, 70, and 80 minutes from start of treatment. U10 shows the diameter of the vessels 10 minutes after finishing the treatment. The bars denote the standard error of the means.

