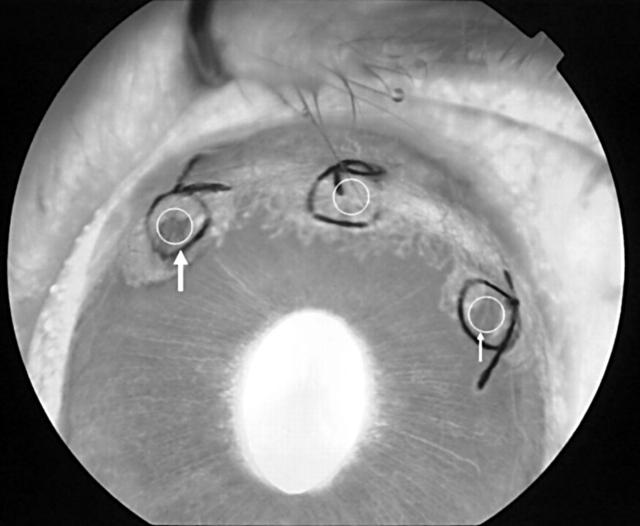
Figure 1.
The fluorescein angiographic image 3 hours after PDT. The circles between two sutures are the areas that were irradiated. The left circle (large arrow) was irradiated 30 seconds after ICG injection and the right circle (small arrow) 5 minutes after ICG injection. The middle circle was untreated.

