Figure 2.

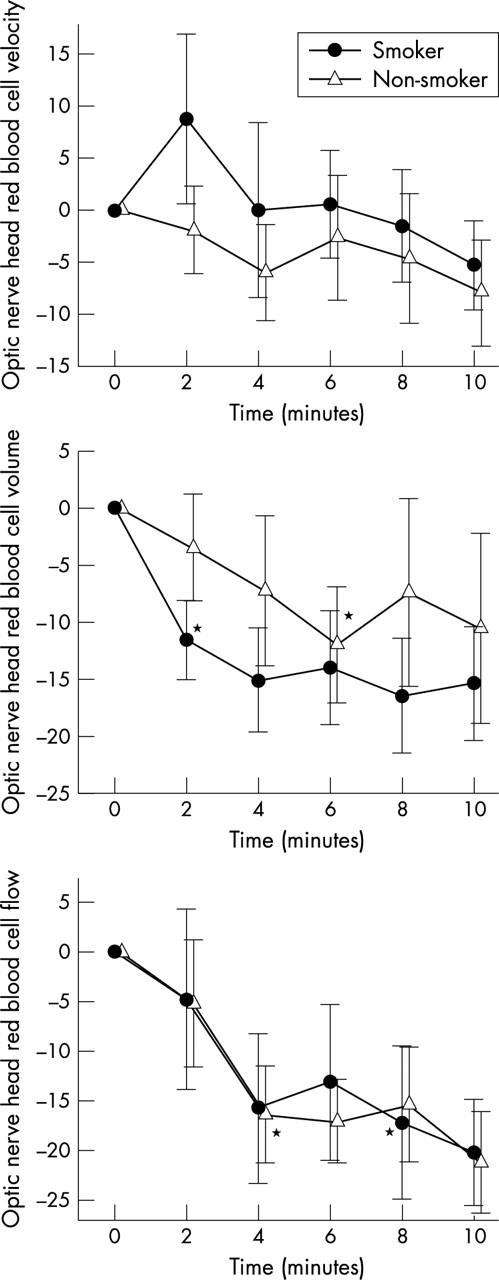
Optic nerve head red blood cell velocity, volume, and flow during carbogen breathing. Data are presented as mean (SEM) (smokers, n = 13; non-smokers, n = 12). *Significant difference versus baseline (t test, post hoc testing).

Optic nerve head red blood cell velocity, volume, and flow during carbogen breathing. Data are presented as mean (SEM) (smokers, n = 13; non-smokers, n = 12). *Significant difference versus baseline (t test, post hoc testing).