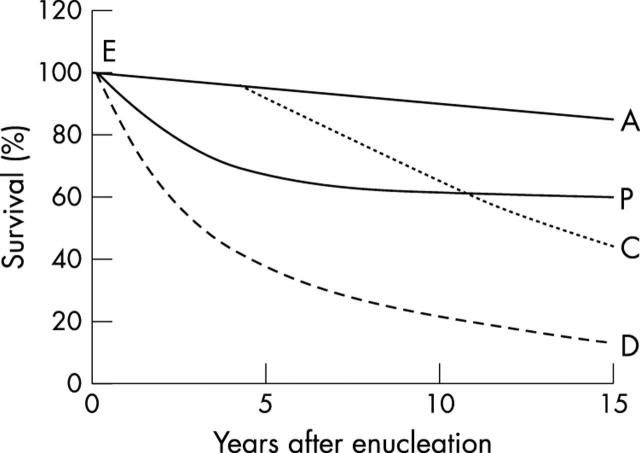
Figure 2.
Observed and hypothetical survival curves following enucleation for uveal melanoma. E indicates the time of enucleation. EP is observed survival curve. EA, EC, and ED are hypothetical survival curves of untreated patients. EA represents the survival curve with low and steady mortality rate of 1%. EC represents survival with moderately increased mortality rate. ED represents survival with markedly increased mortality rate. Reproduced with permission from Zimmerman et al.1

