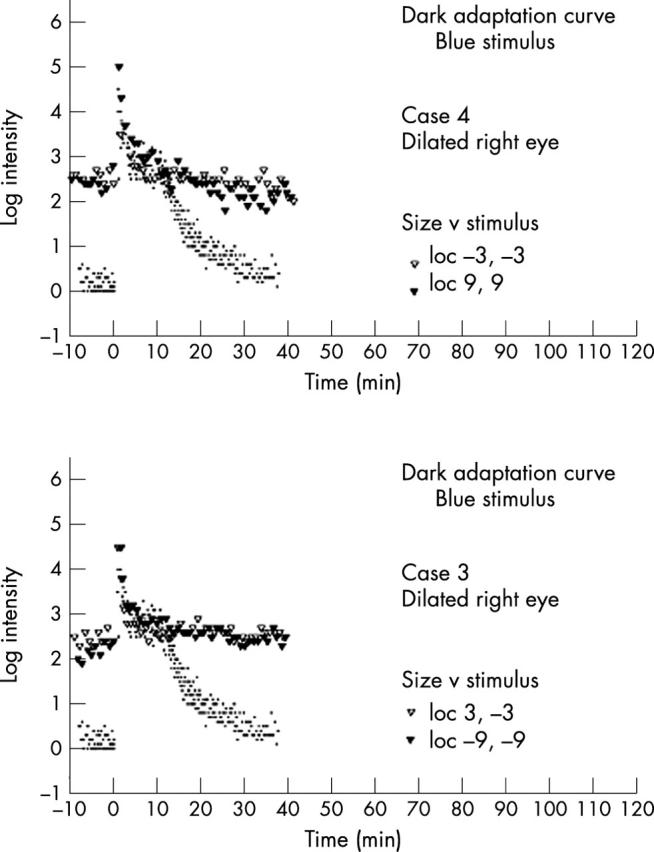
Figure 6.

Dark adaptation curves. Log threshold using red test flash following strong adaptation plotted against time in the dark as measured at 3° and 9° from centre. Dots represent normal controls from averaging of three normal patients under similar testing conditions.
