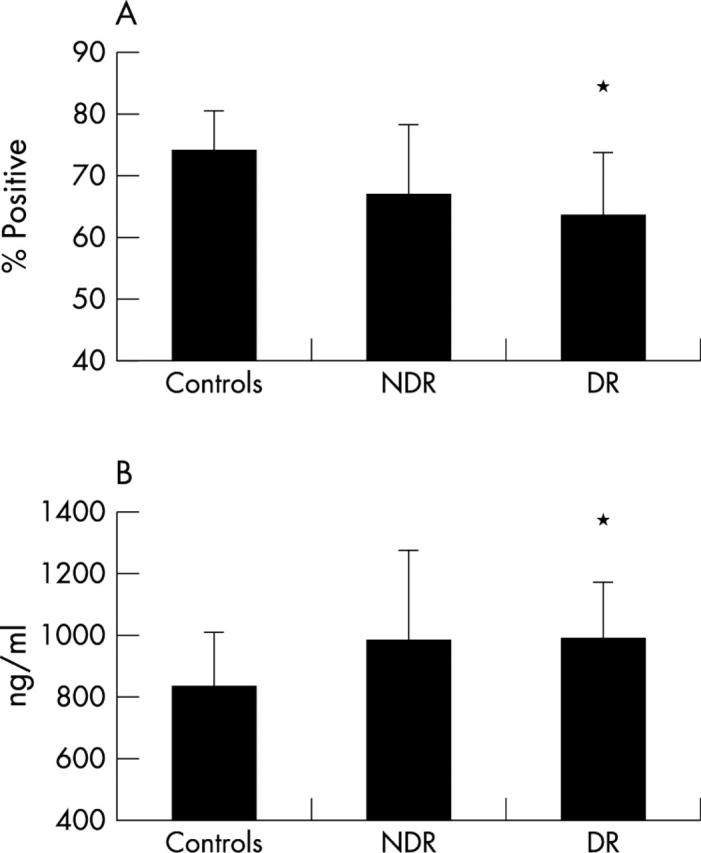
Figure 1.

L-selectin levels on CD3+ cells and in serum. (A) Result from FACS analysis of 17 non-diabetic controls, 15 subjects with NDR and 21 with DR to show surface expression of L-selectin on CD3+ lymphocytes. Mean percentage values and standard deviations are indicated. *Denotes p = 0.004 compared to controls (Mann-Whitney test). (B) Shed levels of L-selectin detected by ELISA in the serum of 12 controls, 14 subjects with NDR, and 14 with DR. Mean values in ng/ml. *Denotes p = 0.04 compared to controls (Mann-Whitney test).
