
Figure 2.
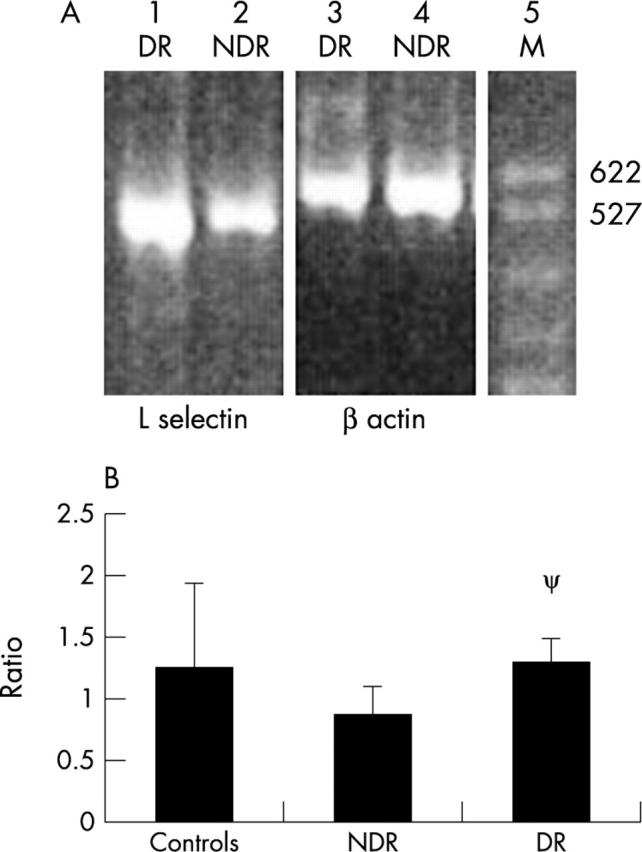
Representative gel of PCR products and result of L-selectin: β actin ratios. (A) Agarose gel visualised under ultraviolet light using the fluorescent properties of ethidium bromide. PCR products for L-selectin (528 base pairs) from a subject with DR in lane 1 and with NDR in lane 2, with their respective β actins (548 base pairs) in lanes 3 and 4 are shown. A DNA marker (DM) is shown in lane 5 with the base pairs of the first two bands indicated. (B) L-selectin: β actin ratios for mononuclear cells from seven controls, six subjects with NDR, and seven with DR. Mean values and standard deviations are indicated. ψ denotes p = 0.007 compared to NDR (Mann-Whitney test).