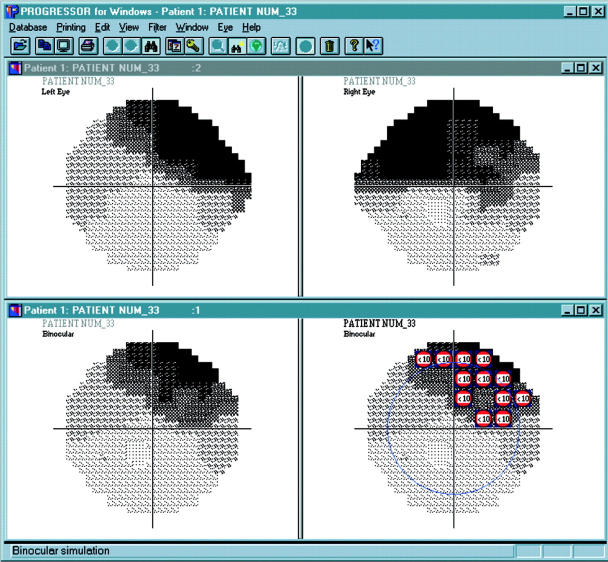
Figure 1.
An image captured from the software developed to produce the integrated visual field. The example shows a patient with visual field defects in both eyes. The left (top left) and right (top right) monocular fields are shown as Humphrey type grey scales. The corresponding sensitivity values from the “overlapped” monocular eyes are simply compared with the maximum or better value, used in the integrated visual field (shown in the lower left panel). The lower right panel is the same binocular reconstruction with superimposed symbols denoting defects with a sensitivity of less than 10 dB; equivalent to threshold measured in the EVFT (the blue circle indicates the 20° field). Clearly this patient’s corresponding monocular visual field damage gives a binocular defect in the upper hemifield of the central field of view.

