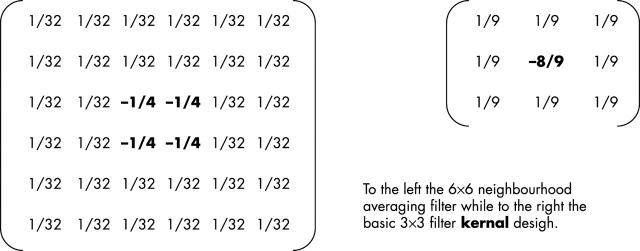
Figure 4.
The neighbourhood averaging filter. A 6×6 matrix (left) was placed on the floor of the optic cup. Each of the 36 cells corresponded to a single pixel or data point on the optic cup image. For each location of the matrix the average depth of the neighbouring cells was calculated as a reference for the centre cell. The value calculated for the centre cell was the difference between its actual depth value and the average depth of its neighbours. If there was no depth difference between a cell and its neighbors then that part of the surface would be relatively flat. Departure from zero depth difference indicates surface variability.

