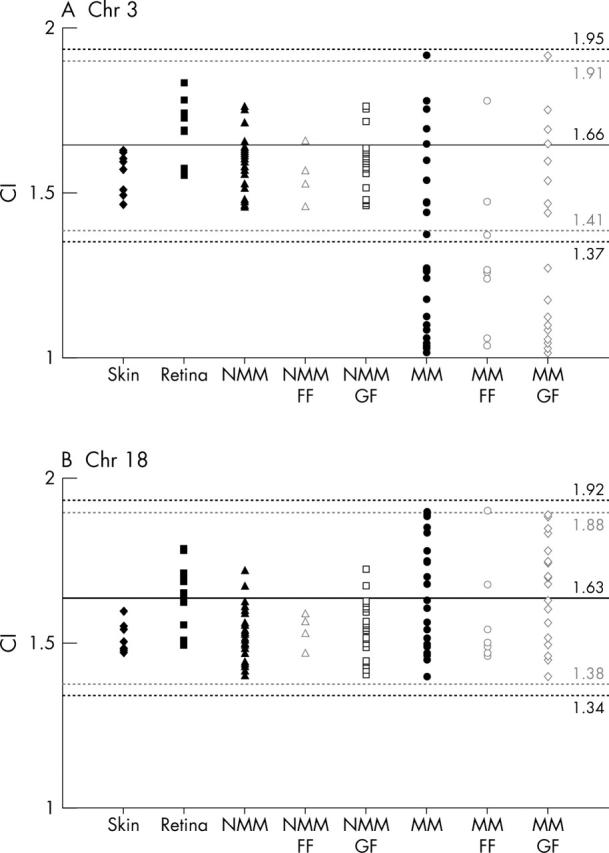
Figure 1.

Scattergram showing distribution of chromosome index (CI) for chromosomes 3 (A) and 18 (B) in skin (solid diamond), retina (solid square), non-metastasising melanoma (NMM solid triangle); formalin fixed (FF, open triangle), glutaraldehyde fixed (GF, open square), and metastasising melanoma (MM solid circle; FF, open circle; GF, open triangle). The lines denotes the mean CI (solid line) (SD 3) (black broken lines) or 2.58 SD (grey broken lines) for retina. Values falling 3 SD below the mean were classified as chromosome loss.
