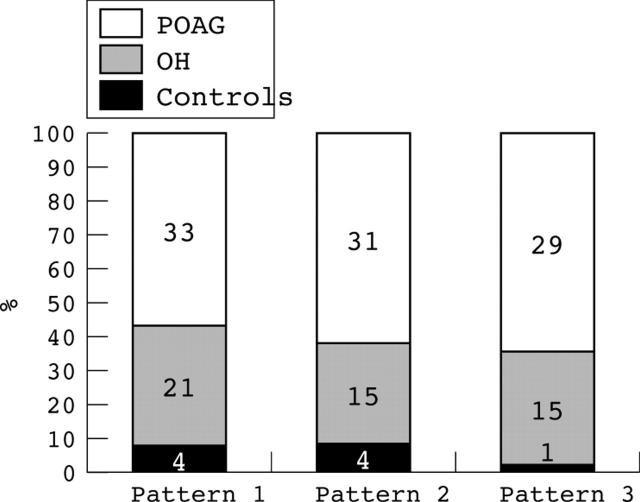
Figure 3.
Histogram showing the number of eyes in the three groups having one of the following patterns of distribution of missed hit rates in the rarebit perimetry test: pattern 1: ⩾2 adjacent areas with a non-hit rate of ⩾50%, with at least one area with a non-hit rate of >50%; pattern 2: ⩾3 adjacent areas with a non-hit rate of ⩾50%, with at least one area with a non-hit rate of >50%; pattern 3: ⩾2 adjacent areas with a non-hit rate of >50%.

