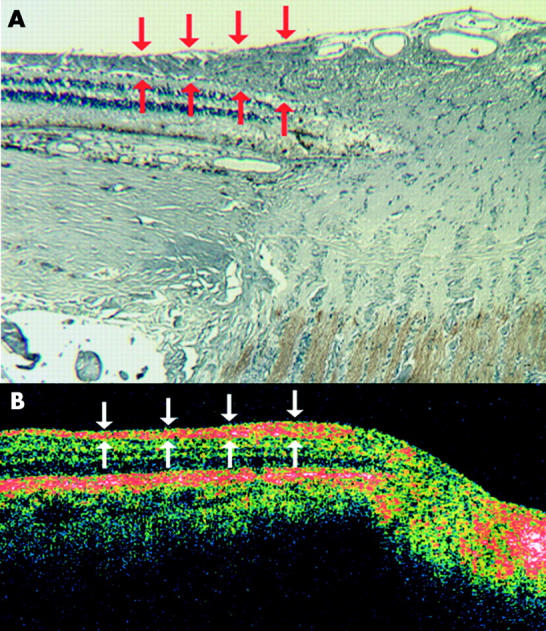
Figure 2.

(A) Histological section of the optic nerve head and peripapillary retina, including the retinal nerve fibre layer (RNFL). Red arrows indicate the progressive thinning of the RNFL at increasing distances from the disc margin. (B) Similar section obtained by optical coherence tomography. Again, RNFL thickness decreases (white arrows) as the distance from the optic nerve head increases. Both A and B are horizontal sections from normal human eyes; they were taken from two different subjects.
