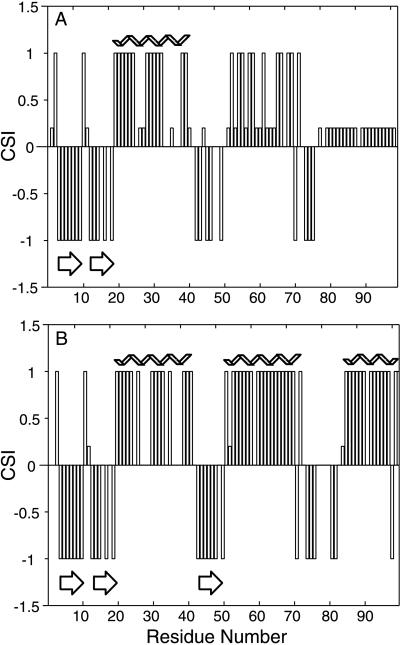
Figure 3.
Plots of consensus CSI values for free Elc1 (A) and VHL(157–171)-bound Elc1 (B). CSI values of +1 reflect residues with helical backbone conformation, and values of −1 reflect regions with extended (β-type) backbone conformation. Unassigned residues are given the value of +0.2. Predicted helices are represented by coiled ribbons and β-strands by arrows.

