
Figure 2.
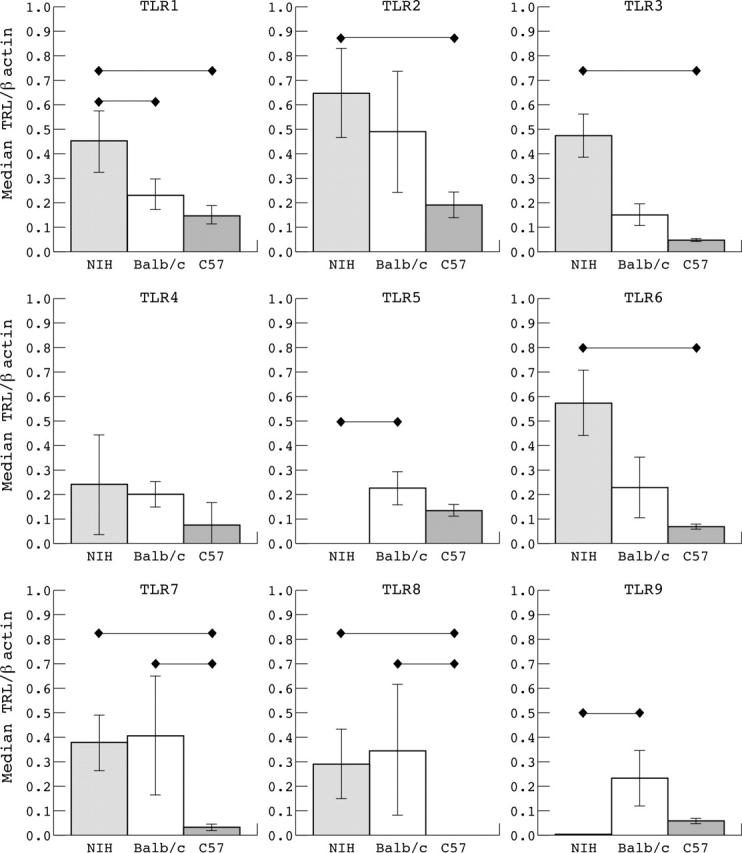
Intensity of mRNA expression of TLRs in the eye of mice. The intensity of each band of figure 1 was measured in an Alpha Imager system. Each bar corresponds to the median value (SD) of the relation TLR/β actin mRNA expression in the whole eye of 10 NIH mice, five Balb/c mice, and five C57BL/6 mice, respectively. Horizontal lines show statistical difference (p<0.05) according to the Kruskal-Wallis test.