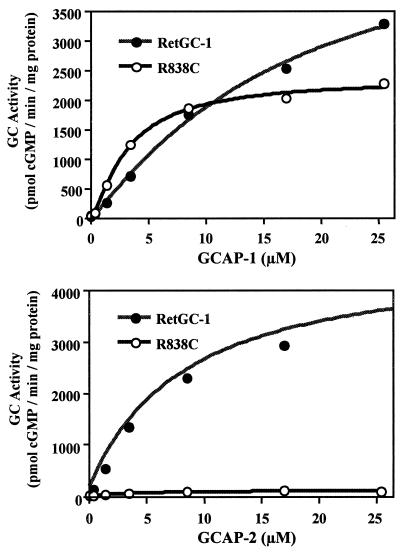
Figure 3.
GCAP-1 and GCAP-2 titrations of R838C and wild-type RetGC-1. GC assays were done as in Fig. 1 with indicated concentrations of GCAP-1 or GCAP-2. A curve was fit to each plot by using the Hill equation v = [GCAP]n Vmax/K1/2n + [GCAP]n. K1/2 [GCAP-1] values derived from the curve fit were 3.2 ± 0.31 μM for R838C, and 16.8 ± 6.7 μM for wild-type RetGC-1.

