

Abstract
Aim: To investigate en face optical coherence tomography (eOCT) and its use as an effective objective technique for assessing changes in the glaucomatous rat optic nerve head (ONH) in vivo, and compare it with confocal scanning laser ophthalmoscopy (cSLO).
Methods: 18 Dark Agouti (DA) rats with surgically induced ocular hypertension were imaged with eOCT and cSLO at regular intervals. Assessment included three dimensional (3D) topographic reconstructions, intensity z-profile plots, a new method of depth analysis to define a “multilayered” structure, and scleral canal measurements, in relation to the degree of intraocular pressure (IOP) exposure.
Results: The increased depth resolution of the eOCT compared to the cSLO was apparent in all methods of analysis, with better discrimination of tissue planes. This was validated histologically. eOCT demonstrated several significant changes in imaged rat ONH which correlated with IOP exposure, including the area of ONH (p<0.01), separation between retinal vessel and scleral layers (p<0.05), and anterior scleral canal opening expansion (p<0.05).
Conclusion: eOCT appears to be effective in assessing rat ONH, allowing detailed structural analysis of the multilayered ONH structure. As far as the authors are aware, this is the first report of scleral canal expansion in a rat model. They suggest eOCT as a novel method for the detection of early changes in the ONH in glaucoma.
Keywords: image analysis, optic disc, glaucoma, intraocular pressure, animal experimentation
Glaucoma is characterised by visual field loss, retinal ganglion cell death, and optic nerve head (ONH) damage, with elevated intraocular pressure (IOP) being defined as the most important treatable risk factor.1,2 A major advance in the field of glaucoma has been the development of imaging techniques that allow objective measurements of the ONH. Until recently, these techniques have not been able to be applied accurately to the increasingly popular rat model of glaucoma, because of the optics and the small size of rat eyes. In addition, three dimensional (3D) in vivo imaging and its correlation with morphometric and histological data has not previously been possible.3–7
Currently, the most popular instrument for imaging the ONH is the confocal scanning laser ophthalmoscope (cSLO), of which the Heidelberg retinal tomograph (HRT) is the best known, producing a colour coded surface topographical map. A recent development in high resolution fundal imaging has been the technique of en face optical coherence tomography (eOCT).8 Unlike conventional OCT,9,10 eOCT processes a series of transverse scans through tissue at equally distributed and specific depths, determined by modern optical sources capable of achieving depth resolutions of up to 3 μm.8
Although optic disc “cupping” has been previously demonstrated in the rat model of glaucoma, an effective objective imaging technique is yet to be established.11 This is important as the rat model is increasingly recognised as a useful tool for studying glaucoma, with similarity to human disease.12 Recently, Burgoyne and co-workers have demonstrated histological changes in the scleral canal in early experimental glaucoma,13,14 which has not been able to be assessed objectively before in vivo in the rat model, even though the HRT has been previously applied in the investigation of rat ONH changes.11
Because of the high depth resolution of the eOCT, we have investigated its application in experimental glaucoma and assessed scleral canal changes in this study, comparing it with the more commonly used imaging device—the scanning laser ophthalmoscope. The aim of this study was to investigate the new technique of eOCT in the analysis of glaucomatous rat ONH and compare it to the cSLO. Several different methods were used in the comparison, including a newly devised approach of depth analysis that enabled assessment of the “multilayered” anatomical structure of the rat ONH.
METHODS
In vivo study design
Adult male Dark Agouti (DA) rats weighing 150–200 g were treated with procedures approved by local ethics committee and the UK Home Office.
Eighteen animals underwent uniocular hypertension surgery, as described by Morrison.15 Briefly, under general anaesthesia, all animals had the IOP in the left eye elevated by injection of 50 μl of hypertonic saline solution (1.80 M) into the episcleral veins with a polypropylene ring around the equator of the globe to prevent hypertonic saline draining and damaging surrounding tissues.15 The animals were kept in constant low light and the IOP was taken at the same time of day on all test days. The IOP of both eyes in each rat was measured under inhalational anaesthesia of a mixture of oxygen and isofluorane, using a Tonopen XL preoperatively and at regular weekly intervals postoperatively. IOP elevation in the eye which had undergone surgery was calculated from the difference between the IOP in the operated and control eyes at each time point and the ΔIOP integral was then calculated for each animal.16,17
Imaging of ONH
Imaging of the ONH was performed under general anaesthetic at baseline and at regular intervals postoperatively, as we have previously described.16,17 Briefly, rats with dilated pupils were placed in a stereotaxic frame and the ONH centred in the image frame. To achieve longitudinal analysis of changes with time, each rat had both eyes assessed repeatedly by the eOCT and cSLO at the same time point. A total of 150 C-scan eOCT images were acquired at 5 μm intervals covering 0.75 mm in depth using a superluminescent diode as the light source (Applied Optics Group Kent University, UK).8 A simultaneously produced confocal SLO image permits the centring of the ONH and monitoring of eye movements. A total of 32 transversal images at 60 μm intervals were then acquired using a Zeiss prototype laser scanning ophthalmoscope (Carl Zeiss, Oberkochen, Germany).18
Image analysis method 1 (fig 1)
Figure 1.

Image analysis method 1. En face OCT (eOCT) imaging of optic nerve head (ONH) in glaucomatous rats with 3D reconstructive blocks of a series of eOCT sections. The images consist of an eOCT image above and a confocal scanning laser ophthalmoscopy (cSLO) image below. Retinal blood vessel layers (RBVL) and scleral layer are easily demonstrated as indicated on the eOCT 3D reconstructive image (A). The edges of the ONH are clearly visible in the cross section through the ONH taken from A (B), and validated by confocal 3D reconstruction of immunohistochemistry (C, colour inset). Progressive widening of the scleral canal was seen in all glaucomatous rats (arrows in D–F). Typical examples of eOCT images (3D reconstructions D–F, XY projections G–I) are shown in the same glaucomatous animal at baseline (D, G), 2 months (E, H) and 3 months (F, I) with IOP integral of 0, 542.65, and 665.85 mm Hg days, respectively.
Pairs of eOCT and cSLO digitised images were collected from each animal at the same time point, and analysed using 3D Doctor software (Able Software Corp. Lexington, MA, USA). The optic disc area (ODA) was determined from 3D reflectance image reconstructions by calculating the area enclosed by a manually drawn contour line outlining the clearly demarcated edges of the optic disc (fig 1G–I). The change in ODA was calculated from the difference between recorded and baseline readings.
Image analysis method 2 (figs 2 and 3)
Figure 2.
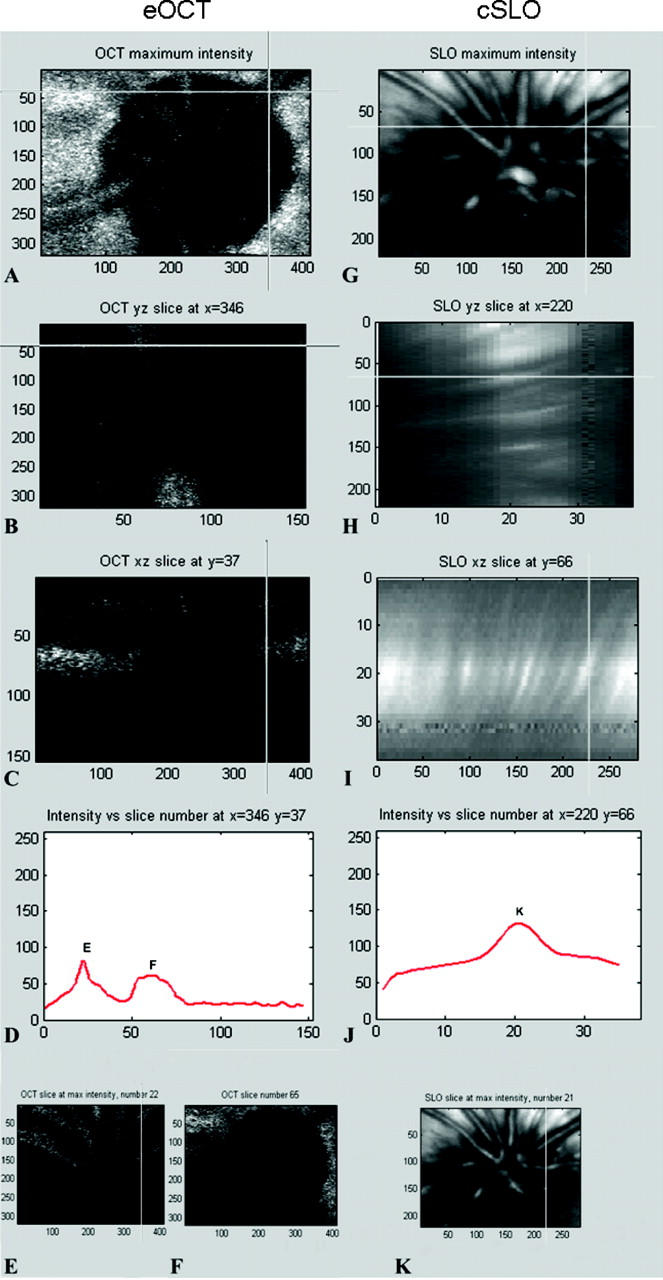
Image analysis method 2 of eOCT (A–F) and cSLO (G–K) images. Reflectance maps (akin to conventional surface topography) show the same eye of the same animal analysed with eOCT (A) and cSLO (G). Corresponding points, selected as shown by the cross intersection in A and G, are further analysed using longitudinal slice reconstructions in the y–z axis (B, H) and x–z axis (C, I). The corresponding confocal z-profile plots are shown in (D) and (J). A double peak z-profile was obtained with eOCT (D) but only a single peak K obtained with cSLO (J). Transversal optical slices corresponding to the peaks, as indicated in (D) and (J), are shown with eOCT (E, F) and cSLO (K).
Figure 3.
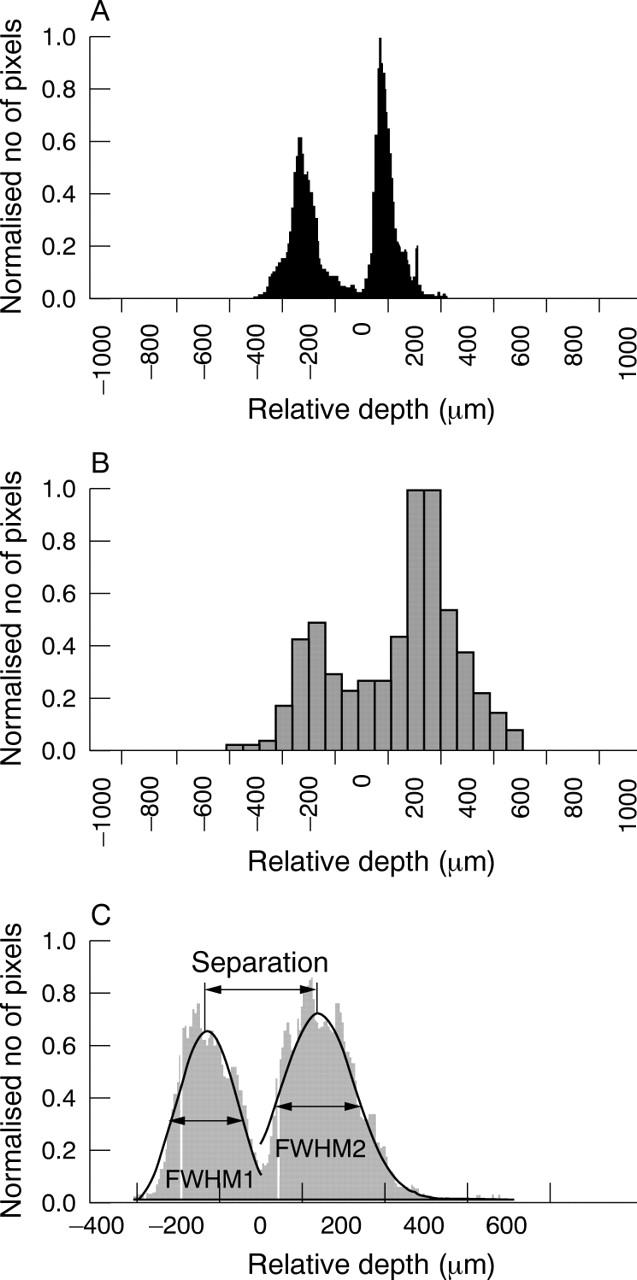
Image analysis method 2. Multisurface depth analysis generating histograms for eOCT (A) and cSLO (B) of the same eye in the same animal. Histograms represent the number of (x,y) locations of the same depth of the reflecting surface (vertical axis) as a function of its depth (horizontal axis). All histograms are centred at the minimum between two peaks and normalised to the highest peak. Compared to cSLO, eOCT produced sharper and narrower peaks. For the analysis, we only included eyes with a double peak histogram for both eOCT and cSLO, where each peak could be approximated by a Gaussian curve. A typical Gaussian curve fit is shown in (C), from which the full width at the half maximum of the first (FWHM1) and second (FWHM2) peaks were calculated, as well as the distance between the two peaks (separation).
3D eOCT and cSLO reconstructions were also analysed using in-house designed software, as shown in figure 2. Conventional surface topography represents a single peak, usually symmetrical confocal z-profile, with the position of the profile maximum defining the location of the light reflecting surface along the z-axis. It relies on the calculation of the centre of gravity of the z-profile and deals with asymmetric profiles by using a proprietary algorithm. Since eOCT clearly discriminates several layers, it produces a multi-peak z-profile, which makes analysis with conventional surface topography inapplicable.
Therefore, we developed a new method constructing a histogram where the total number of (x,y) locations with peak intensity at a specific depth (vertical axis) are represented as a function of depth (horizontal axis). Hence, it defines the total number of pixel locations with the same depth of reflecting surface at any specific depth. As the number of locations (total pixels per image) is different for the SLO (74 800 pixels) and eOCT (153 600 pixels), the total number of (x,y) locations with peak intensity was divided by the maximum number of locations at peak intensity, to create a scale between 0 and 1 (normalised number of pixels, figs 3A, B), in order to allow for direct comparisons between differing imaging techniques and different eyes. All histograms were then centred at the minimum between two peaks. The Gaussian approximation was used to find the full width at the half maximum (FWHM) of each peak (fig 3C). In addition, the separation between peaks was calculated as the distance between maximums of each Gaussian curve (fig 3C).
Image analysis method 3 (fig 4)
Figure 4.
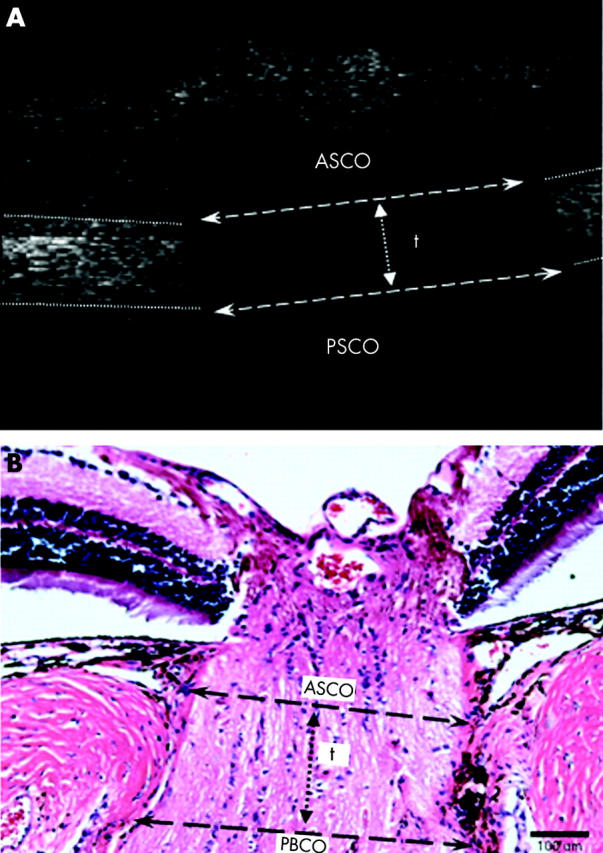
Image analysis method 3. A typical longitudinal slice from a 3D eOCT image in which the anterior scleral canal opening (ASCO), posterior scleral canal opening (PSCO) and scleral canal thickness (“t”) are marked as indicated (A). Corresponding measurements in the paraffin cross section through the ONH of a normal rat eye stained with haematoxylin and eosin, are shown for comparison (B).
This method used the longitudinal slice images produced in method 2 (see fig 2C), and consequently was only appropriate to eOCT. Longitudinal slices were taken through the middle of the optic disc, as determined from the reflectivity maps of each eye. The anterior scleral canal opening (ASCO) was defined as the maximal opening diameter in the anterior surface of the sclera, as delineated in figure 4A. Likewise, the posterior scleral canal opening (PSCO) was defined as the maximal opening diameter in the posterior surface of the sclera. For an estimate of the effect of compression on the scleral canal, we measured the thickness of the edges (fig 4A, “t”) of the scleral canal. Figure 4B shows these corresponding measurements in the histological section through the ONH of a normal eye.
Histology
Animals were sacrificed immediately following in vivo imaging at 3 months of study. Eyes were enucleated, fixed, and dissected16,17 and 2 mm diameter full thickness specimens centred around the ONH obtained. The retinal nerve fibre layer was identified using mouse anti-rat neurofilament 200 kDa antibody (NF-200, Sigma, UK, 1:1000).19 Scleral and nuclei labelling was performed with cirius red (PSR, Sigma) and 4’,6’-diamidino-2-phenylindole (DAPI, Sigma, 1:2500). 3D reconstructions were obtained from images acquired using confocal microscopy.16,17
Statistical analysis
All methods were assessed for reproducibility and accuracy, using the coefficient of variation to assess interobserver and intraobserver variation, with multiple observers (LG, AM, MFC, VT).20
Statistical analysis was performed to assess correlation of indicated parameters in the above three methods in relation to integral ΔIOP, using Pearson’s correlation coefficient.17 ANOVA was used to investigate differences between eOCT and cSLO techniques.
RESULTS
Method 1: change in optic disc area
3D reconstructions demonstrate the high depth resolution of eOCT permitting the identification of distinct retinal and scleral layers (fig 1A, 1B). The edges of the ONH (scleral canal) are clearly visible in the cross section block through the ONH (fig 1B). These same structures identified in eOCT were seen in corresponding histological 3D blocks (fig 1C). Comparison between thickness of the posterior sclera with 3D reconstructions from eOCT (88.54 (SD 2.59) μm) and confocal microscopy (77.29 (6.23) μm), suggest some tissue shrinkage with fixation processing. Progressive widening of the scleral canal was seen in all glaucomatous eyes, with typical examples shown in figures 1D–I.
Interobserver and intraobserver coefficients of variation were similar to those previously published for HRT,20 being 4.4 and 2.6 respectively.
Comparison between eOCT and cSLO in terms of change in ODA, showed a much narrower range for eOCT. Although there was no significant difference between the methods (fig 5C, ANOVA p = 0.2180), we found no correlation either (fig 5C, Pearson’s correlation coefficient).
Figure 5.
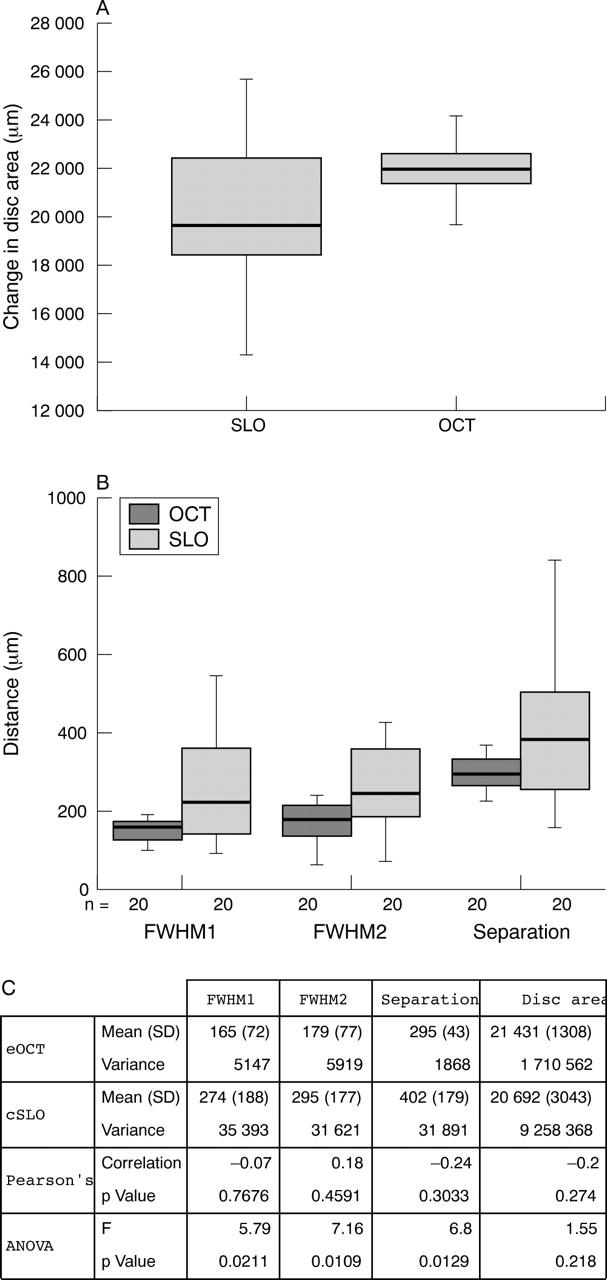
Comparison of eOCT and cSLO using data acquired in methods 1 (A) and 2 (B) with corresponding box plots (A, B) and descriptive statistics (C). The eOCT demonstrates a narrow range for all three parameters compared to the larger spread and high variance of the same parameters assessed by the cSLO. Whereas no correlation was found between eOCT and cSLO in any parameter measured (Pearson’s correlation coefficient), there was a significant difference between the two imaging techniques for each parameter (ANOVA, p<0.05).
Method 2: longitudinal slices and z-profiles
The high depth resolution of eOCT is plainly apparent as two anatomical reflecting surfaces separated by approximate 300 μm (50 frames) can be clearly distinguished (fig 2B, C). The transversal frames at the depth corresponding to the intensity maximum of each peak (fig 2D) clearly illustrate that the first peak arises from the retinal blood vessels (fig 2E) while the second peak arises from the scleral layer (fig 2F). Retinal thickness was not assessed.
By contrast with the eOCT, we were unable to demonstrate a double layer structure with cSLO images (fig 2G–K). Instead, a widely spread reflecting surface along the z-axis is seen in the longitudinal slices (fig 2H, 2I). Again, this is confirmed by the intensity z-profile, where there is only one peak with 600 μm FWHM (10 frames, fig 2J). The transversal frame at the intensity maximum is illustrated in figure 2K.
Method 2: multisurface depth analysis
A histogram obtained from eOCT 3D images (fig 3A) has two clearly separated peaks corresponding to both reflective objects—that is, the retinal blood vessels and scleral layer. Compared to eOCT, the cSLO histogram of the same animal has wider, less distinct peaks (fig 3B). Double peak cSLO histograms were obtained only in 20 out of the possible 40 paired series of images.
Comparison between eOCT and cSLO histograms using the parameters of FWHM1, FWHM2, and the separation between peaks, demonstrates a narrower range for eOCT compared to the larger spread and high variance of the same parameters assessed by the cSLO. Again this is very much related to the poorer depth resolution of the cSLO, which makes estimates of tissue plane separation almost meaningless. There was no correlation between eOCT and cSLO in any parameter measured (fig 5C, Pearson’s correlation coefficient). However, there was a significant difference between the two methods for each parameter (fig 5C, ANOVA, p<0.05).
This method, unlike methods 1 and 3, does not rely on the subjective judgment of any parameter, as it provides complete objective data taken from the block of images acquired directly from the machine. Hence, it cannot be biased by observer interpretation.
All methods: analysis of changes in ONH structure with IOP exposure
All three methods were used to assess the ability of the eOCT to determine changes in the ONH with IOP exposure. Surgery produced an increase of IOP in all eyes with mean peak IOP elevation of 30.12 (2.93) mm Hg and mean ΔIOP integral of 615.56 (79.39) mm Hg days at 3 months. The mean duration of IOP elevation was 57.39 (7.95) days.
Using method 1, we demonstrated progressive widening of the optic disc in both 3D reconstructions and XY projections over the 3 month period of study (fig 1). We found a significant correlation between the change in ODA and ΔIOP integral (fig 6A, Pearson’s r = 0.564, p<0.01).
Figure 6.
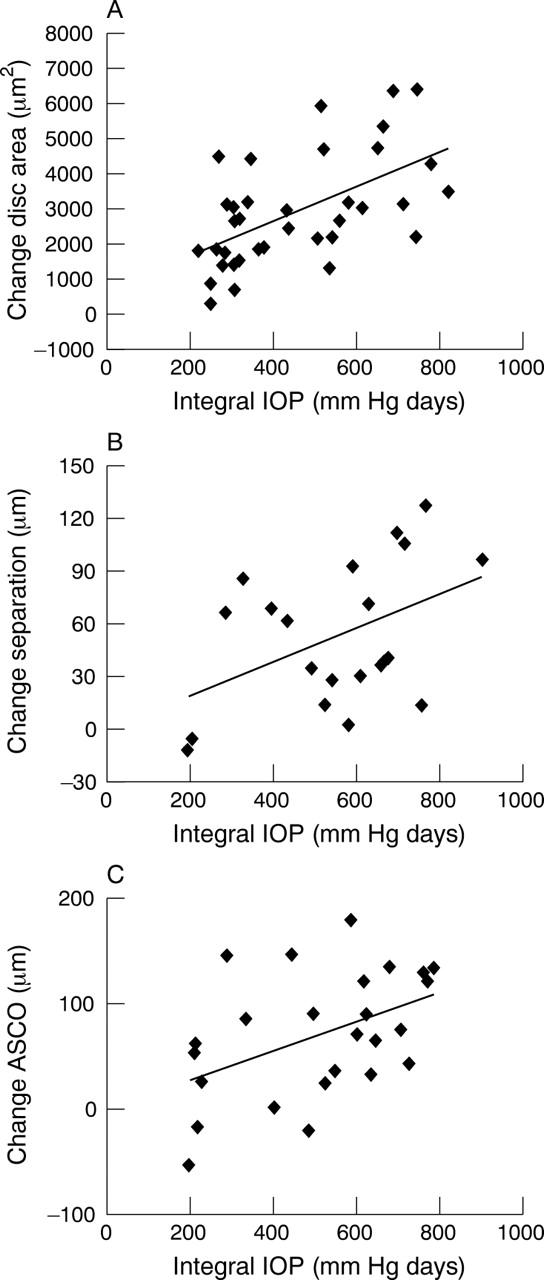
Analysis of changes in ONH structure with IOP exposure using eOCT. The change in disc area was found to be significantly correlated with ΔIOP integral, (A, Method 1, Pearson’s r = 0.546, p<0.01), as was the degree of separation between the two anatomical layers, corresponding to the retinal blood vessel and the scleral layers (B, Method 2, Pearson’s r = 0.456, p<0.05). Furthermore, we found a positive correlation between anterior scleral canal opening (ASCO) expansion and ΔIOP integral (C, Method 3, Pearson’s r = 0.462, p<0.05). All these results suggest that the eOCT can be used to objectively assess anatomical changes in ONH structure over time in glaucomatous rats.
With the depth analysis histograms obtained using method 2, we found the parameter that changed most with IOP exposure in glaucomatous rats was “separation.” This anatomically represents the “distance” between the retinal blood vessels and scleral layers. Figure 6B shows a significant correlation of “separation” with integral ΔIOP (fig 6B, Pearson’s r = 0.456, p<0.05). However we found no correlation between ΔIOP integral and FWHM1 or FWHM2.
Our analysis of method 3 showed interobserver and intraobserver coefficients of variation similar to those previously published for HRT,20 being 4.0 and 1.6, respectively. This method demonstrated progressive enlargement of the ASCO, representing the maximal opening diameter in the anterior surface of the sclera, in the same animals and in relation to integral ΔIOP. For example, in the animal shown in figure 1D–F, the ASCO measurements were 665 μm, 819 μm, and 919 μm at baseline, 2 months and 3 months respectively, corresponding to the integral IOP of 0, 542.65, and 665.85 days. The duration of IOP elevation in this animal was 48 days with a peak elevation in IOP of 26 mm Hg. Progressive enlargement of the ASCO was significantly associated with integral ΔIOP (fig 6C, Pearson’s r = 0.462, p<0.05). Although we found a trend for the PSCO to increase with IOP exposure, this was not statistically significant. We found no correlation with the “thickness” of the scleral canal (“t”) and integral ΔIOP.
DISCUSSION
Objective assessment of the rat model of glaucoma has until recently not been possible. This is due to the small size of the rat eye and the poor depth resolution of currently available imaging techniques.11 We report the use of the new technique of eOCT in the in vivo investigation of ONH changes in rat glaucoma. Comparison of the eOCT with the cSLO shows the superiority of eOCT using a number of different methods, including a newly devised method of depth analysis that allows assessment of a multilayered anatomical structure. The multilayered structure of the rat ONH defined by the eOCT is consistent with our histology findings, as validated by confocal microscopy. Finally, using eOCT, we have analysed for the first time in vivo, changes in the scleral canal in rat glaucoma and their relation to IOP exposure.
Although fundus photography shows enlargement of the disc margin, suggesting also some enlargement of the scleral canal, it does not permit absolute quantification.21–23 Chauhan et al have recently advocated the use of the HRT for in vivo assessment of ONH changes in the rat model of glaucoma.11 However, the authors acknowledged that the limits of the depth resolution of the HRT and the complex structure of the rat ONH made the data, including volume assessment of the optic disc, difficult to interpret.11 There is a clear need therefore for an accurate imaging method to permit detailed analysis of changes at the rat ONH in vivo.
We employed eOCT, a new imaging technique, to assess structural changes in rat ONH with IOP exposure. Like HRT with cSLO, eOCT processes a series of transverse scans through the ONH. However, it is more powerful than HRT, as its depth resolution is 10 times higher, allowing for a larger number of slices to be acquired. Tissue surfaces are more clearly detected by the eOCT, allowing delineation of structures such as the scleral canal at the ONH. This is not achievable with HRT, and may explain why Chauhan and colleagues detected ONH cupping as a late feature.11 We suggest that as eOCT is a sensitive method of detecting structural changes in the ONH, perhaps even before significant axonal loss has occurred, it may permit the early identification of disease processes.
The depth histogram method developed in this study allows a detailed depth analysis of multilayered structures. This is objective and parametric analysis which cannot be biased by observer variation. We have shown, using the parameters of FWHM1, FWHM2 and “separation,” that measurements obtained by eOCT were consistently more accurate and with lower variance than the cSLO. This is to be expected since the high depth resolution of eOCT enables discrimination of two reflecting surfaces. This also explains why the spread of data, as illustrated by the variance factor, is considerable (at least six times greater) with cSLO compared to the eOCT. This high degree of variance also explains why we found no correlation between the two imaging techniques in depth analysis, and in fact showed a significant difference between them in the readings obtained.
Our data show that compared to the PSCO, expansion of the ASCO is positively correlated with IOP exposure. Although Chauhan and colleagues demonstrated scleral canal expansion with HRT, objective measurements of the ASCO and PSCO were not possible.11 As far as we are aware, this is the first time it has been possible to study these scleral canal parameters in vivo.
Burgoyne and colleagues have recently highlighted the ASCO as an important structural element in glaucoma.13,14,24–28 Scleral canal expansion has also been identified as occurring in acute IOP elevation and in childhood glaucoma, being attributed to posteriorly directed stress forces at the ONH and increased compliance of young connective tissue.13,14,24,29,30 This may be related to the fact that the lamina cribrosa (LC) is known to alter its biophysical properties with age, including an increase in stiffness and a decrease in reversal ability with age.31,32
The ASCO represents the edge of the LC-like structure in the rat ONH, and like the human LC, this area is more vulnerable to IOP stress.33,34 Our observations of IOP related deformation of anterior scleral canal support the clinical fact of early peripheral vision loss in glaucoma patients as a result of damage to the nerve fibres crossing the edge of the ONH.35,36 The increased susceptibility of the ASCO compared to the PSCO may also be because of changes associated with pressure and depth,37 such that the anterior location of the ASCO would be expected to be maximally affected by IOP compared to the PSCO. Finally, expansion of the ASCO may be related to the effects of IOP on tissue compression/stretching. Compression at the edge of the LC appears to increase as the lamina thins.33 Hence, the shear strain would be reached at lower IOPs in a “thin” compared to a “thick” LC. However we found no evidence of significant compression, as defined by scleral canal wall thickness (“t”) in relation to IOP exposure in this study.
Precise measurements of ONH cupping or scleral canal expansion are an important prerequisite in experimental glaucoma, and there is a real need for objective data when assessing new therapies and strategies for this disease. The enhanced depth resolution of the eOCT compared to cSLO appears advantageous in assessing rat ONH to allow detailed structural analysis of the multilayered ONH structure. Burgoyne and co-workers have suggested that widening of the ASCO may be an early sign of glaucomatous damage.13,14 We propose that the eOCT has great potential in the early detection and diagnosis of glaucomatous disease in patients.
Acknowledgments
The authors would like to acknowledge Annelie Maass and Ted Garway-Heath.
Supported by The Wellcome Trust GR063658
AGhP and DAJ have received research funding from Ophthalmic Technologies Inc, Toronto Canada and The New York Eye and Ear Infirmary, USA.
Abbreviations
ASCO, anterior scleral canal opening
cSLO, confocal scanning laser ophthalmoscopy
3D, three dimensional
DA, Dark Agouti
eOCT, en face optical coherence tomography
FWHM, full width at the half maximum
HRT, Heidelberg retinal tomograph
IOP, intraocular pressure
LC, lamina cribrosa
ODA, optic disc area
ONH, optic nerve head
PSCO, posterior scleral canal opening
REFERENCES
- 1.Anderson DR. The management of elevated intraocular pressure with normal optic discs and visual fields. I. Therapeutic approach based on high risk factors. Surv Ophthalmol 1977;21:479–89. [DOI] [PubMed] [Google Scholar]
- 2.Sommer A . Intraocular pressure and glaucoma. Am J Ophthalmol 1989;107:186–8. [DOI] [PubMed] [Google Scholar]
- 3.Radius RL, Pederson JE. Laser-induced primate glaucoma. II. Histopathology. Arch Ophthalmol 1984;102:1693–8. [DOI] [PubMed] [Google Scholar]
- 4.Sawaguchi S , Yue BY, Fukuchi T, et al. Collagen fibrillar network in the optic nerve head of normal monkey eyes and monkey eyes with laser-induced glaucoma—a scanning electron microscopic study. Curr Eye Res 1999;18:143–9. [DOI] [PubMed] [Google Scholar]
- 5.Morrison JC, Dorman-Pease ME, Dunkelberger GR, et al. Optic nerve head extracellular matrix in primary optic atrophy and experimental glaucoma. Arch Ophthalmol 1990;108:1020–4. [DOI] [PubMed] [Google Scholar]
- 6.Johnson EC, Morrison JC, Farrell S, et al. The effect of chronically elevated intraocular pressure on the rat optic nerve head extracellular matrix. Exp Eye Res 1996;62:663–74. [DOI] [PubMed] [Google Scholar]
- 7.Pena JD, Agapova O, Gabelt BT, et al. Increased elastin expression in astrocytes of the lamina cribrosa in response to elevated intraocular pressure. Invest Ophthalmol Vis Sci 2001;42:2303–14. [PubMed] [Google Scholar]
- 8.Rogers J , Podoleanu A, Dobre G, et al. Topography and volume measurements of the optic nerve using en-face optical coherence tomography. Optics Express 2001;9:533–45. [DOI] [PubMed] [Google Scholar]
- 9.Huang D , Swanson EA, Lin CP, et al. Optical coherence tomography. Science 1991;254:1178–81. [DOI] [PMC free article] [PubMed] [Google Scholar]
- 10.Hee MR, Puliafito CA, Wong C, et al. Quantitative assessment of macular edema with optical coherence tomography. Arch Ophthalmol 1995;113:1019–29. [DOI] [PubMed] [Google Scholar]
- 11.Chauhan BC, Pan J, Archibald ML, et al. Effect of intraocular pressure on optic disc topography, electroretinography, and axonal loss in a chronic pressure-induced rat model of optic nerve damage. Invest Ophthalmol Vis Sci 2002;43:2969–76. [PubMed] [Google Scholar]
- 12.Hernandez MR, Pena JD. The optic nerve head in glaucomatous optic neuropathy. Arch Ophthalmol 1997;115:389–95. [DOI] [PubMed] [Google Scholar]
- 13.Bellezza AJ, Rintalan CJ, Thompson HW, et al. Anterior scleral canal geometry in pressurised (IOP 10) and non-pressurised (IOP 0) normal monkey eyes. Br J Ophthalmol 2003;87:1284–90. [DOI] [PMC free article] [PubMed] [Google Scholar]
- 14.Bellezza AJ, Rintalan CJ, Thompson HW, et al. Deformation of the lamina cribrosa and anterior scleral canal wall in early experimental glaucoma. Invest Ophthalmol Vis Sci 2003;44:623–37. [DOI] [PubMed] [Google Scholar]
- 15.Morrison JC, Moore CG, Deppmeier LM, et al. A rat model of chronic pressure-induced optic nerve damage. Exp Eye Res 1997;64:85–96. [DOI] [PubMed] [Google Scholar]
- 16.Cordeiro MF, Guo L, Luong V, et al. Real time imaging of single nerve cell apoptosis in retinal neurodegeneration. Proc Natl Acad Sci USA 2004;101:13352–6. [DOI] [PMC free article] [PubMed] [Google Scholar]
- 17.Guo L , Moss SE, Alexander RA, et al. Retinal ganglion cell apoptosis in glaucoma is related to intraocular pressure (IOP) and IOPinduced effects of extracellular matrix. Invest Ophthalmol Vis Sci 2005;46:175–82. [DOI] [PMC free article] [PubMed] [Google Scholar]
- 18.Fitzke F . Colour imaging using a scanning laser ophthalmoscope. Br J Ophthalmol 1998;82:337–8. [DOI] [PMC free article] [PubMed] [Google Scholar]
- 19.Naskar R , Wissing M, Thanos S. Detection of early neuron degeneration and accompanying microglial responses in the retina of a rat model of glaucoma. Invest Ophthalmol Vis Sci 2002;43:2962–8. [PubMed] [Google Scholar]
- 20.Garway-Heath DF, Poinoosawmy D, Wollstein G, et al. Interobserver and intraobserver variation in the analysis of optic disc images: comparison of the Heidelberg retina tomograph and computer assisted planimetry. Br J Ophthalmol 1999;83:664–9. [DOI] [PMC free article] [PubMed] [Google Scholar]
- 21.Sawada A , Neufeld A. Confirmation of the rat model of chronic, moderately elevated intraocular pressure. Exp Eye Res 1999;69:525–31. [DOI] [PubMed] [Google Scholar]
- 22.Cohan BE, Pearch AC, Jokelainen PT, et al. Optic disc imaging in conscious rats and mice. Invest Ophthalmol Vis Sci 2003;44:160–3. [DOI] [PubMed] [Google Scholar]
- 23.Neufeld A , Sawada A. Inhibition of nitric-oxide synthase 2 by aminoguanidine provides neuroprotection of retinal ganglion cells in a rat model of chronic glaucoma. Proc Natl Acad Sci USA 1999;96:9944–8. [DOI] [PMC free article] [PubMed] [Google Scholar]
- 24.Robin AL, Quigley HA, Pollack IP, et al. An analysis of visual acuity, visual fields, and disk cupping in childhood glaucoma. Am J Ophthalmol 1979;88:847–58. [DOI] [PubMed] [Google Scholar]
- 25.Weinreb RN, Dreher AW, Bille JF. Quantitative assessment of the optic nerve head with the laser tomographic scanner. Int Ophthalmol 1989;13:25–9. [DOI] [PubMed] [Google Scholar]
- 26.Weinreb RN, Lusky M, Bartsch DU, et al. Effect of repetitive imaging on topographic measurements of the optic nerve head. Arch Ophthalmol 1993;111:636–8. [DOI] [PubMed] [Google Scholar]
- 27.Brigatti L , Weitzman M, Caprioli J. Regional test-retest variability of confocal scanning laser tomography. Am J Ophthalmol 1995;120:433–40. [DOI] [PubMed] [Google Scholar]
- 28.Zangwill L , Shakiba S, Caprioli J, et al. Agreement between clinicians and a confocal scanning laser ophthalmoscope in estimating cup/disk ratios. Am J Ophthalmol 1995;119:415–21. [DOI] [PubMed] [Google Scholar]
- 29.Quigley HA, Hohman RM, Addicks EM, et al. Morphologic changes in the lamina cribrosa correlated with neural loss in open-angle glaucoma. Am J Ophthalmol 1983;95:673–91. [DOI] [PubMed] [Google Scholar]
- 30.Jonas JB, Gusek GC, Naumann GO. Optic disc morphometry in chronic primary open-angle glaucoma. I. Morphometric intrapapillary characteristics. Graefes Arch Clin Exp Ophthalmol 1988;226:522–30. [DOI] [PubMed] [Google Scholar]
- 31.Albon J , Purslow PP, Karwatowski WS, et al. Age related compliance of the lamina cribrosa in human eyes. Br J Ophthalmol 2000;84:318–23. [DOI] [PMC free article] [PubMed] [Google Scholar]
- 32.Albon J , Karwatowski WS, Easty DL, et al. Age related changes in the non-collagenous components of the extracellular matrix of the human lamina cribrosa. Br J Ophthalmol 2000;84:311–17. [DOI] [PMC free article] [PubMed] [Google Scholar]
- 33.Edwards ME, Good TA. Use of a mathematical model to estimate stress and strain during elevated pressure induced lamina cribrosa deformation. Curr Eye Res 2001;23:215–25. [DOI] [PubMed] [Google Scholar]
- 34.Mathematical modelling of the effect of elevated intraocular pressure on the lamina cribosa. 16th ASCE Engineering Mechanics Conference. Seattle: University of Washington, 16–18 July, 2003.
- 35.Minckler DS. The organization of nerve fiber bundles in the primate optic nerve head. Arch Ophthalmol 1980;98:1630–6. [DOI] [PubMed] [Google Scholar]
- 36.Quigley HA, Addicks EM. Regional differences in the structure of the lamina cribrosa and their relation to glaucomatous optic nerve damage. Arch Ophthalmol 1981;99:137–43. [DOI] [PubMed] [Google Scholar]
- 37.Morgan WH, Yu DY, Alder VA, et al. The correlation between cerebrospinal fluid pressure and retrolaminar tissue pressure. Invest Ophthalmol Vis Sci 1998;39:1419–28. [PubMed] [Google Scholar]