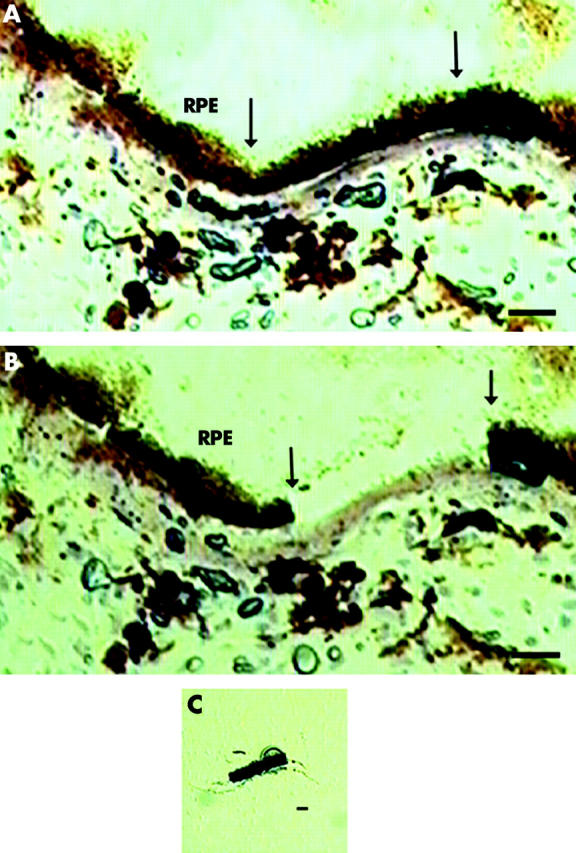
Figure 1.

Photomicrograph of macular RPE/Bruch’s membrane with normal morphology before (A) and after (B) laser capture microdissection, as described in the methods. Arrow indicates area of laser dissection. Five laser spots dissected five RPE cells, as seen on the transfer cap (C). Bar = 10 μm.
