
Figure 1.
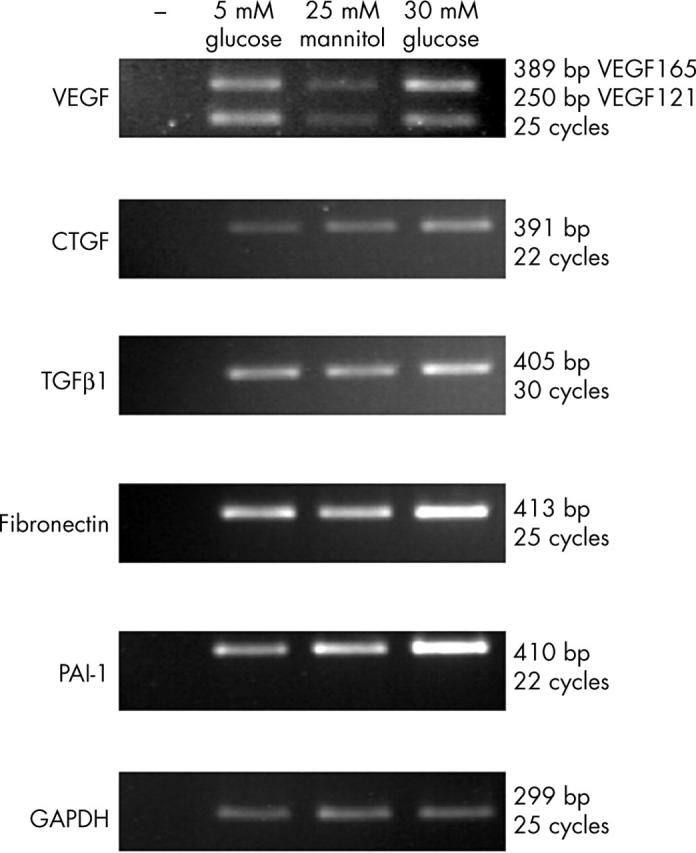
Glucose regulated gene expression in BRPC. RT-PCR analyses of quantitatively standardised total RNA samples from BRPC cultured in 5 mM glucose, 5 mM glucose, and 25 mM mannitol (as an osmolarity control), or 30 mM glucose for 7 days. SDW was used as a negative control instead of cDNA and is indicated by -. 18S ribosomal RNA was used as a control for equal input amounts of RNA.