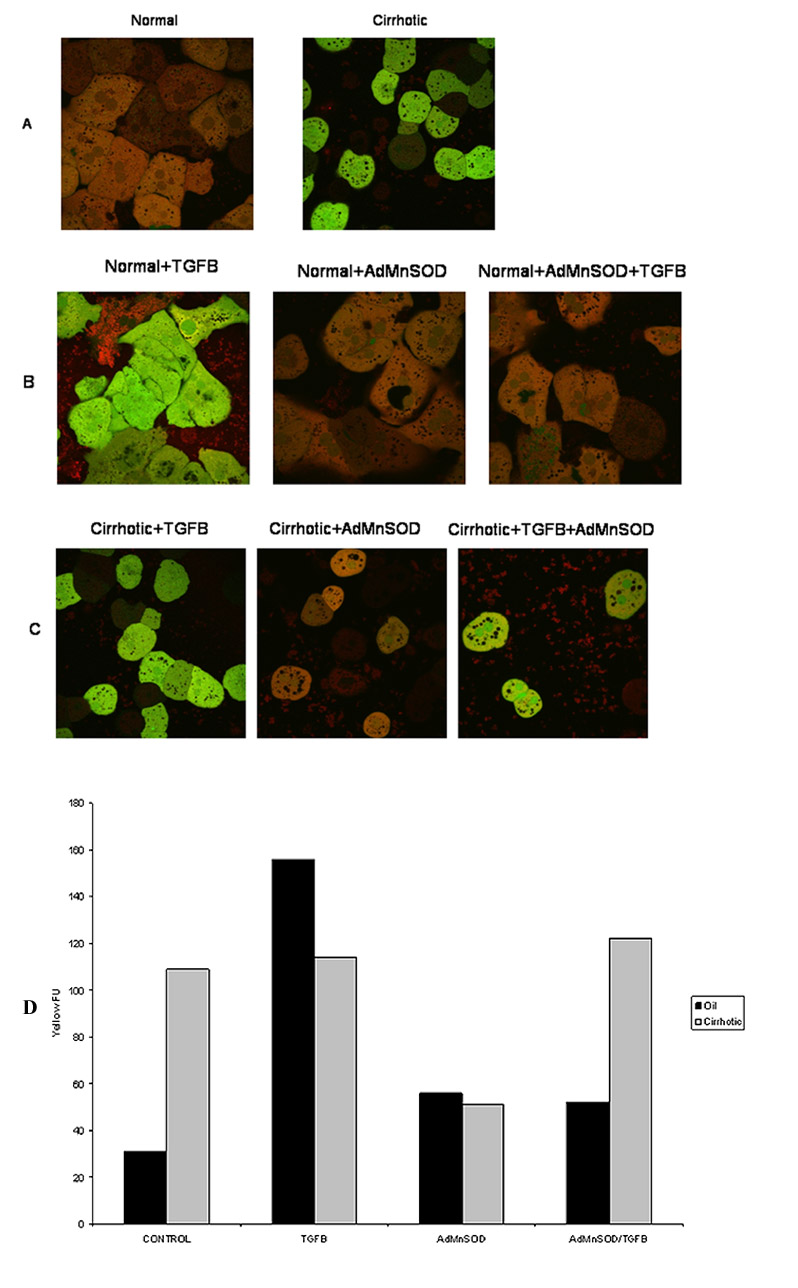
Figure 4.

Normal and cirrhotic hepatocytes were loaded with the fluorophores H2-DCFDA (2 μM; green) to assess ROS formation and MitoTracker Red (MTR 500 nM; red) to localize respiring mitochondria. Confocal microscopy was performed at 90 minutes following TGFβ (5 ng/ml) administration. (A) Normal (left) and cirrhotic (right) hepatocytes were imaged without treatment. Note a low mitochondrial ROS formation in normal hepatocytes while diffused ROS formation in cirrhotic hepatocytes. (B) Normal hepatocytes were treated with TGFβ for 90 min. Some hepatocytes were transfected with AdMnSOD for 24 hours prior to TGFβ treatment. Confocal imaging revealed a ROS burst in the mitochondria (yellow fluorescence, left panel), which was suppressed by AdMnSOD transfection (middle and right panel). (C) Confocal imaging of cirrhotic hepatocytes. TGFβ alone did not caused a mitochondrial ROS burst (left panel). Although AdMnSOD alone (middle panel) decreased ROS generation, subsequent TGFβ administration induced a mitochondrial ROS burst (yellow, right panel). (D) Quantification of yellow fluorescence, an indication of mitochondrial generation of ROS for control and cirrhotic hepatocytes treated with TGFβ, AdMnSOD or TGFβ and AdMnSOD.
