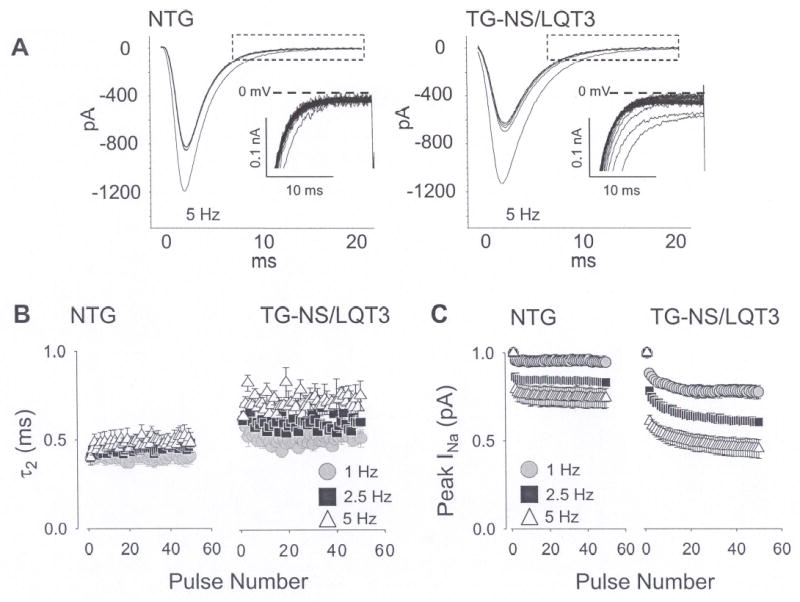
Fig. 2.

Rate-dependent reduction in peak and late INa. (A) A series of 50 consecutive INa currents are shown and these were elicited by 50 ms square steps from −80 to −20 mV at 5 Hz. Summaries for peak and late INa values at 1, 2.5, and 5 Hz are illustrated in the adjacent figures and these are plotted against pulse number. (B) Peak INa was measured as the peak current amplitude remaining relative to the 1st pulse. (C) INa,L was estimated quantitatively by fitting the declining phase of INa with a biexponential function, I/Imax = A1x(1-e(−t/τ1)) + A2x(1-e(−t/τ2)) and plotting the slow time component, τ2.
