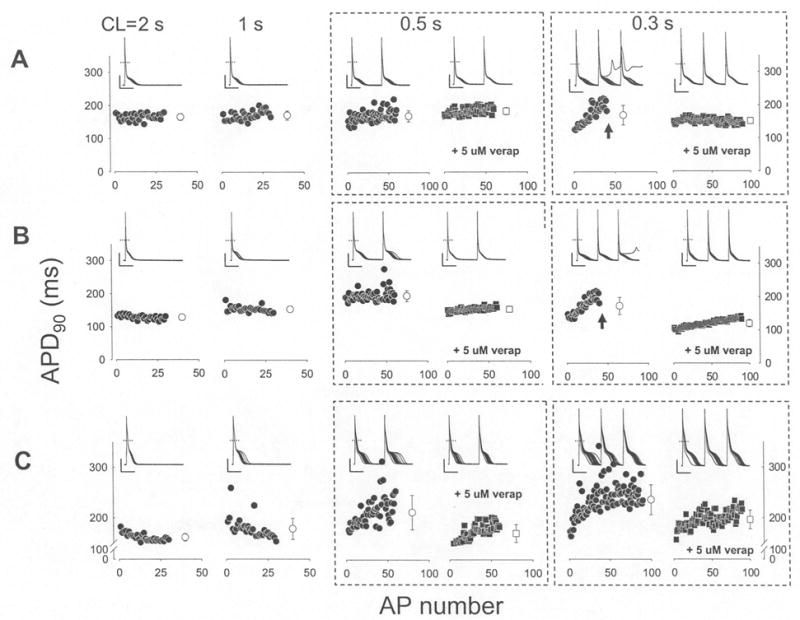
Fig. 3.

Verapamil prevents inhomogenous APD restitution at increasing rates. AP recordings were recorded from TG-NS/LQT3 cells at CLs of 2, 1, 0.5 and 0.3 sec. Representative recordings from three TG-NS/LQT3 cells (A, B, C) and their APD90 (90% repolarization) values (filled symbols) were plotted below as a function of AP number within each recording sweep; there was a total of 30 sweeps at each CL. An average value (open symbols ± SD) is indicated at the end of each data set. For CLs of 0.5 and 0.3 sec, recording traces and plots include pre- and post-administration of 5 uM verapamil. Failure to maintain stimulation capture (arrows) is indicated. The dashed horizontal line represents 0 mV and the vertical and horizontal solid lines indicate 20 pA and 0.1 sec scales, respectively.
