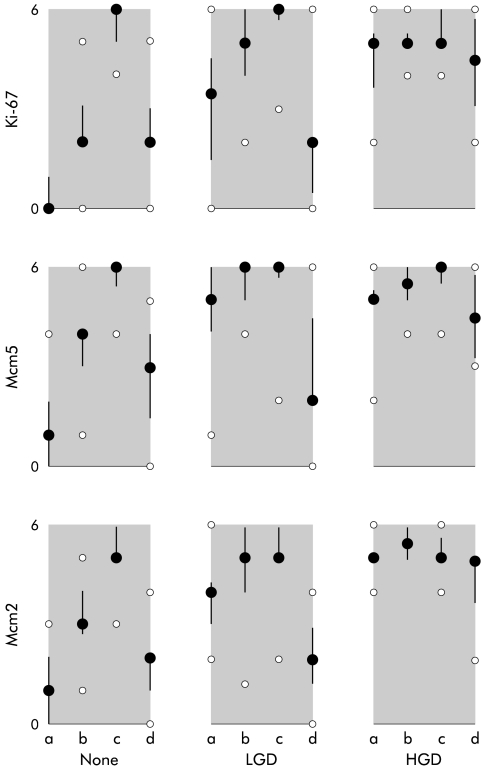
Figure 2.
Graphs of minichromosome maintenance protein (Mcm) and Ki-67 expression in Barrett's mucosa: quartile plots of immunohistochemical scores (range 0–6) for Ki-67, Mcm5, and Mcm2 (rows 1–3). Columns from left to right represent Barrett's mucosa without dysplasia (none), low grade dysplasia (LGD), and high grade dysplasia (HGD). Mucosal layers are represented as a–d with a=deep glands; b=lower crypt; c=upper crypt; and d=mucosal surface. Filled dots represent medians, bars interquartile range, and small open dots the range.

