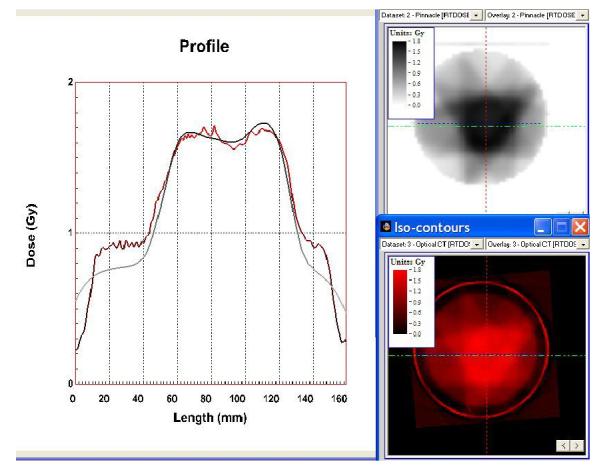
Figure 8.

profiles through the calculated IMRT distribution (upper right) and the gel-measured distribution (lower right). The line of the profile is the horizontal green line in the right hand plots.

profiles through the calculated IMRT distribution (upper right) and the gel-measured distribution (lower right). The line of the profile is the horizontal green line in the right hand plots.