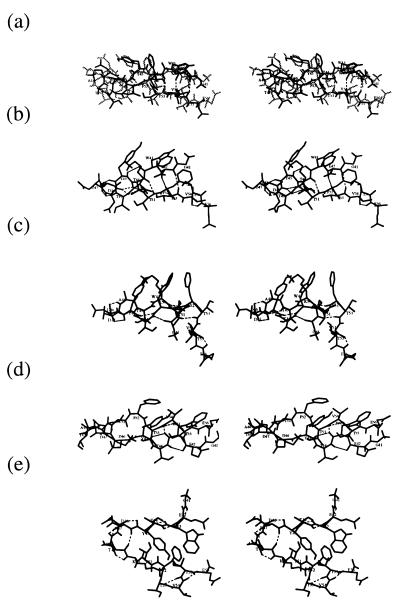
Figure 2.
Stereo views of minimized average structures of high probability clusters at 300 K. (a) The most probable cluster (black) (10.7%) compared with the structure shown in Fig. 1 a (gray). (b–e) Clusters with overall rms deviations from the native structure of more than 3.0 Å.

